

Question: Construct -R Chart and show calculations for the following: From the given data find out control limits for X-bar & R chart. Calculate standard
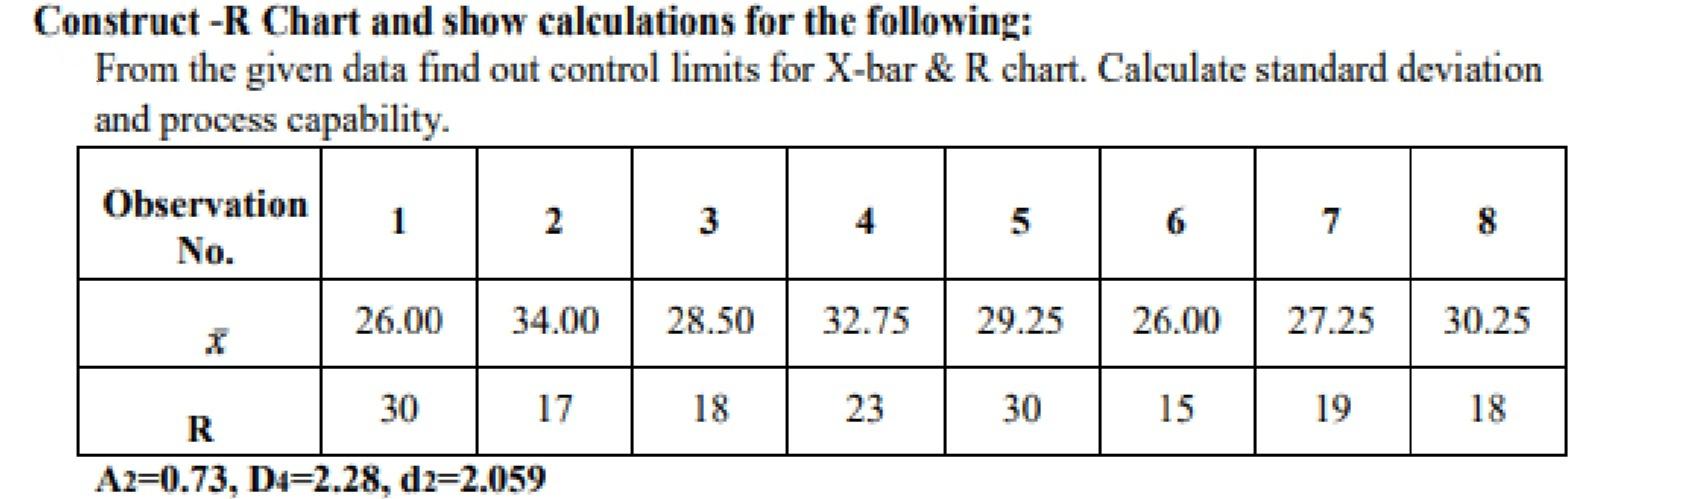
Construct -R Chart and show calculations for the following: From the given data find out control limits for X-bar & R chart. Calculate standard deviation and process capability. Observation 1 2 3 4 6 7 8 No. 26.00 34.00 28.50 32.75 29.25 26.00 27.25 30.25 30 17 18 23 30 15 19 18 R Az=0.73, D4=2.28, d232.059
Step by Step Solution
★★★★★
3.55 Rating (159 Votes )
There are 3 Steps involved in it
1 Expert Approved Answer
Step: 1 Unlock

Question Has Been Solved by an Expert!
Get step-by-step solutions from verified subject matter experts
Step: 2 Unlock
Step: 3 Unlock