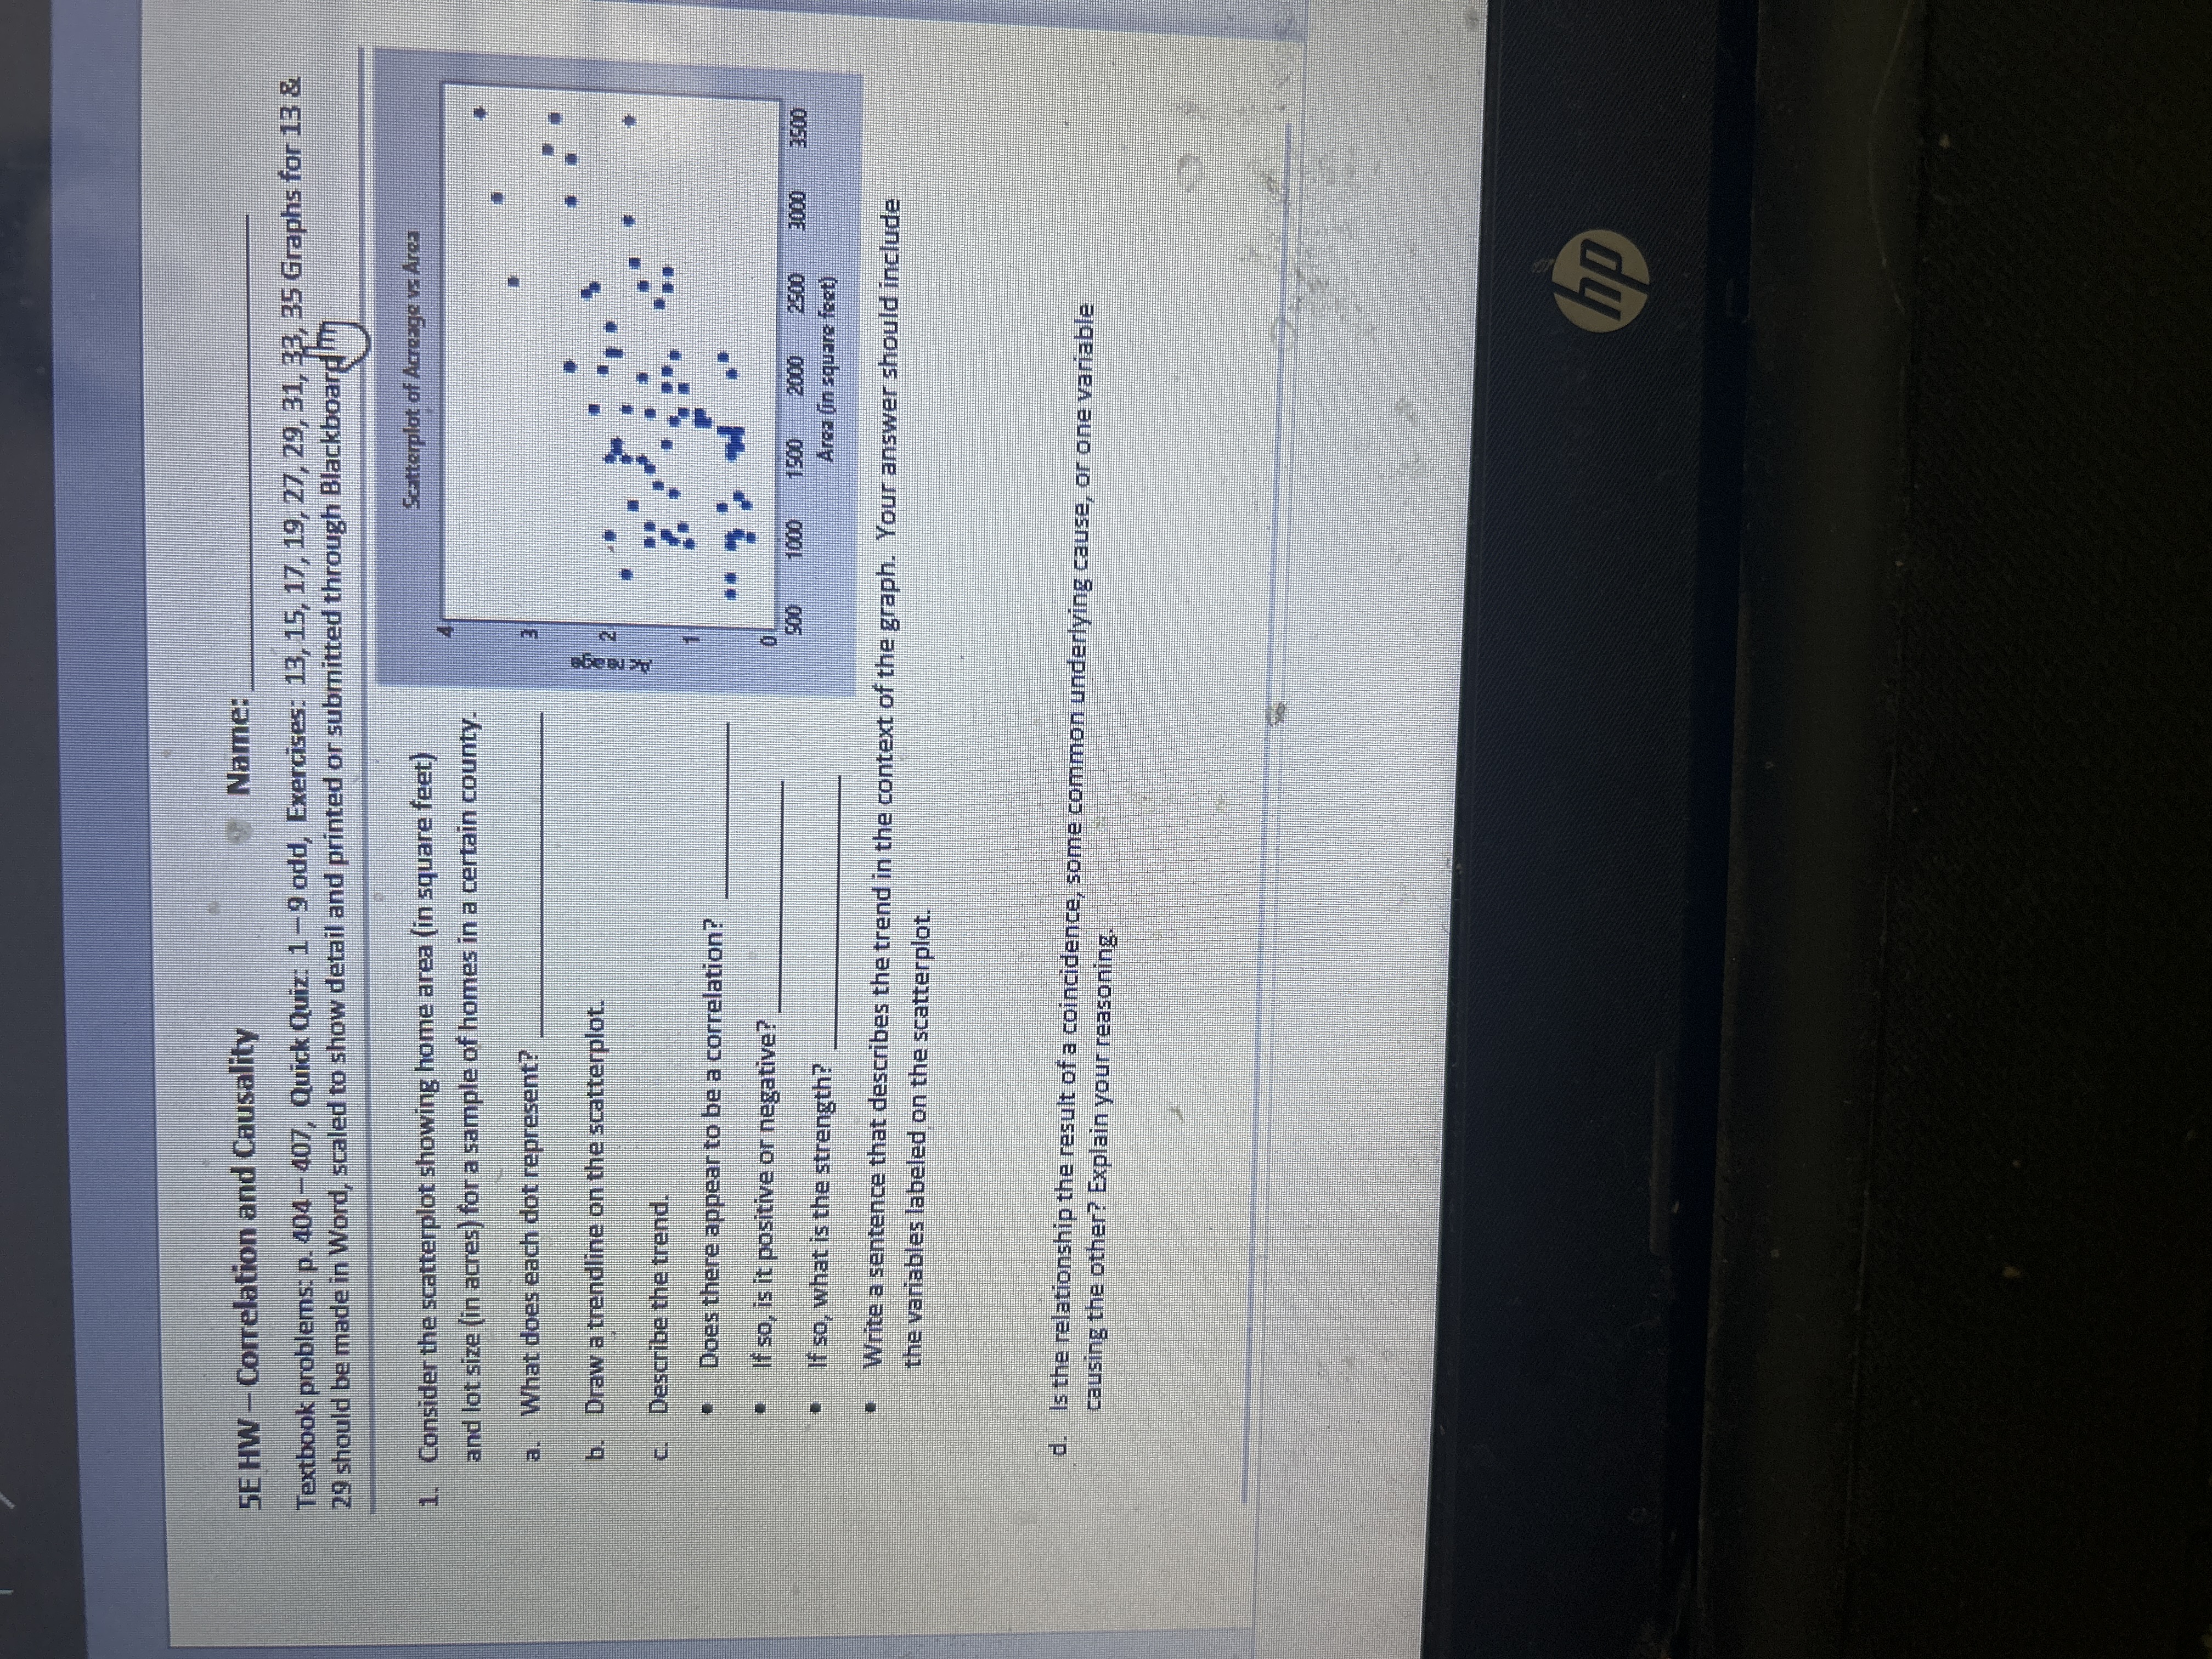
Question: Please solve this SE HW - Correlation and Causality Name: Textbook problems: p. 404-407, Quick Quiz: 1-9 odd, Exercises: 13, 15, 17, 19, 27, 29,

Please solve this

Please solve this SE HW - Correlation and
SE HW - Correlation and Causality Name: Textbook problems: p. 404-407, Quick Quiz: 1-9 odd, Exercises: 13, 15, 17, 19, 27, 29, 31, 33, 35 Graphs for 13 & 29 should be made in Word, scaled to show detail and printed or submitted through BlackboardIm Consider the scatterplot showing home area (in square feet) Scatterplot of Acreage vs Area and lot size (in acres) for a sample of homes in a certain county. What does each dot represent? Draw a andline on the scatterplot. Describe the tre Does there appear to be a correlation? If so, is it positive or negative? 500 1000 1500 2000 2500 3000 3500 If so, what is the strength? Area (in square feet) Write a sentence that describes the trend in the context of the graph. Your answer should include the variables labeled on the scatterplot. . Is the relationship the result of a coincidence, some common underlying cause, or one variable causing the other? Explain your reasoning hp

Step by Step Solution

There are 3 Steps involved in it

1 Expert Approved Answer
Step: 1 Unlock blur-text-image
Question Has Been Solved by an Expert!

Get step-by-step solutions from verified subject matter experts

Step: 2 Unlock
Step: 3 Unlock

Students Have Also Explored These Related Mathematics Questions!