

Question: please solve using excel and show all steps/equations Energy Son Drinks others to be pornity developed and started marketing a new wodt drink. The waters
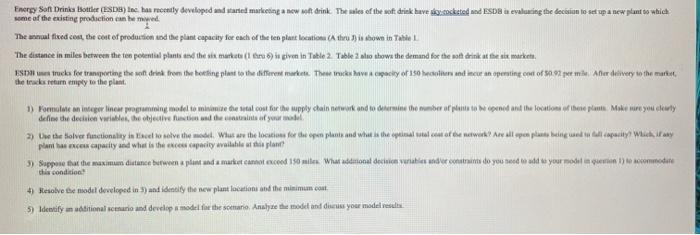
 please solve using excel and show all steps/equations
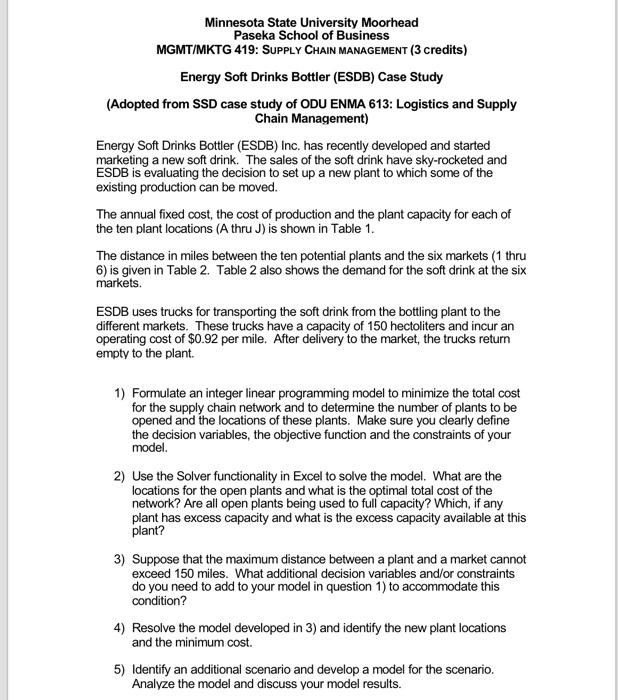
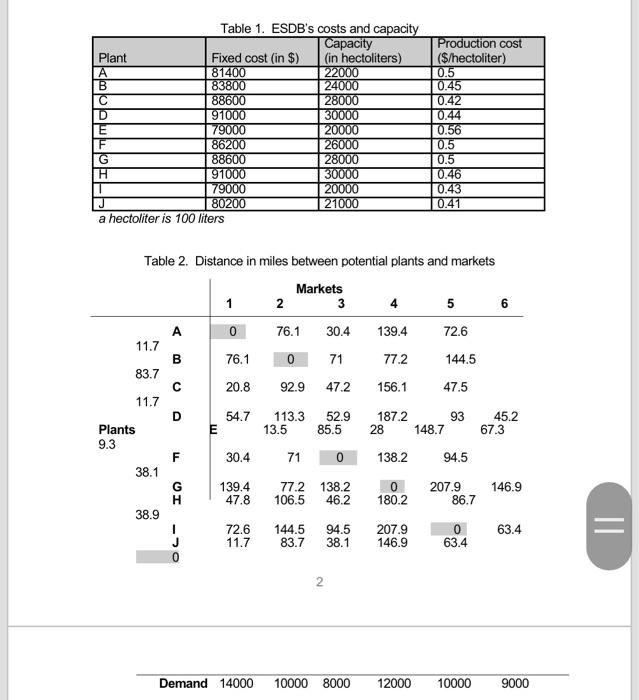
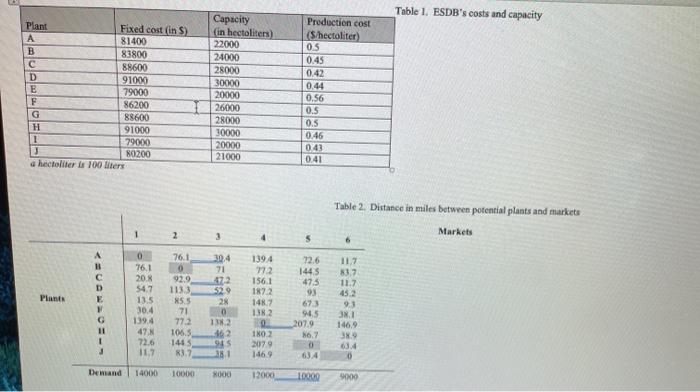
Energy Son Drinks others to be pornity developed and started marketing a new wodt drink. The waters of the soft drink Lave skozcocketed und ESD as evaluating the decision to set up a new plant to which some of the eating production can be med The annual fixed con, the cost of production and the plant capacity for each of the ten plantation the shown in Table The distance in miles between the ten potential plants and the sis market (1 tonu 9 ta pilven in Tablo 2 Table 2 aluo show the demand for the mott drink at the site markets, 178 ur trucka for transporting the on, dried from the betting plant to the different market. These tracks have a capacity of 150 hecolher and incur an operating cost of $0.9% per min. Aber divery to the market, the treeply to the plant 1) Formule an integer inom programming model to minimize the site out for the supply chain network and to determine the rumber of paper and the locations of these plate. Make sure you chewy define the decision with the decis of your 2) the the folver functionality in inel solve the most. What we the location for the open pland what is the place of work? Are all open plants being dapat di plantas con capacity and what is the capacity available at the planet 5) Suppose that the maximum ditunet butween a plant and a market cannot exceed 150 miles What additionat decine vraties under constraints do you need to add to your model in querien 1) ecommodine this condition 4) Resolve the model developed in and identify the new plant location and the minimum cont 5) Identifyin aditional semario and develop model for the sono Anahe the model and in your model resul Table 1. ESDB's costs and capacity Plant Fixed cost in S) A 81400 B 83800 C 88600 D 91000 E 79000 F 86200 G 88600 H 91000 1 79000 J 80200 a hectoliters 100 liters Capacity (in hectoliters) 22000 24000 28000 30000 20000 26000 28000 30000 20000 21000 Production cost (5 hectoliter) 0.5 0.45 0.42 0.44 0.56 0.5 0.5 0.46 0.43 0.41 Table 2. Distance in miles between potential plants and markets 1 2 Markets 3 4 5 6 1394 772 D E Plants 0 76.1 20.8 547 13.5 30.4 139.4 47 72.6 117 76.1 0 92.9 113.3 55 71 772 106,5 1465 83.2 30,4 71 472 529 28 0 13.2 162 945 72.6 1445 47.5 93 673 945 2079 36.7 0 63.4 156.1 1872 148.7 1382 0 180 2 2079 1469 11.7 83,7 11.7 452 93 38.1 146.9 389 G 11 1 0 Demand 14000 10000 000 12000 10000 9000 Minnesota State University Moorhead Paseka School of Business MGMT/MKTG 419: SUPPLY CHAIN MANAGEMENT (3 credits) Energy Soft Drinks Bottler (ESDB) Case Study (Adopted from SSD case study of ODU ENMA 613: Logistics and Supply Chain Management) Energy Soft Drinks Bottler (ESDB) Inc. has recently developed and started marketing a new soft drink. The sales of the soft drink have sky-rocketed and ESDB is evaluating the decision to set up a new plant to which some of the existing production can be moved. The annual fixed cost, the cost of production and the plant capacity for each of the ten plant locations (A thru J) is shown in Table 1. The distance in miles between the ten potential plants and the six markets (1 thru 6) is given in Table 2. Table 2 also shows the demand for the soft drink at the six markets. ESDB uses trucks for transporting the soft drink from the bottling plant to the different markets. These trucks have a capacity of 150 hectoliters and incur an operating cost of $0.92 per mile. After delivery to the market, the trucks return empty to the plant. 1) Formulate an integer linear programming model to minimize the total cost for the supply chain network and to determine the number of plants to be opened and the locations of these plants. Make sure you clearly define the decision variables, the objective function and the constraints of your model. 2) Use the Solver functionality in Excel to solve the model. What are the locations for the open plants and what is the optimal total cost of the network? Are all open plants being used to full capacity? Which, if any plant has excess capacity and what is the excess capacity available at this plant? 3) Suppose that the maximum distance between a plant and a market cannot exceed 150 miles. What additional decision variables and/or constraints do you need to add to your model in question 1) to accommodate this condition? 4) Resolve the model developed in 3) and identify the new plant locations and the minimum cost. 5) Identify an additional scenario and develop a model for the scenario. Analyze the model and discuss your model results. Table 1. ESDB's costs and capacity Capacity Plant Fixed cost (in $) (in hectoliters) A 81400 22000 B 83800 24000 88600 28000 D 91000 30000 E 79000 20000 F 86200 26000 G 88600 28000 H 91000 30000 1 79000 20000 J 80200 21000 a hectoliter is 100 liters Production cost ($/hectoliter) 0.5 0.45 0.42 0.44 0.56 0.5 0.5 0.46 0.43 0.41 Table 2. Distance in miles between potential plants and markets Markets 1 2 3 4 5 6 A 0 76.1 30.4 139.4 72.6 11.7 B 76.1 0 71 77.2 144.5 83.7 20.8 92.9 47.2 156.1 47.5 11.7 D 54.7 93 113.3 13.5 52.9 85.5 187.2 28 45.2 67.3 E 148.7 Plants 9.3 F 30.4 71 0 138.2 94.5 38.1 146.9 G H 139.4 47.8 77.2 138.2 106.5 46.2 207.9 86.7 38.9 0 180.2 207.9 146.9 72.6 11.7 144.5 83.7 94.5 38.1 0 63.4 = 63.4 2 Demand 14000 10000 8000 12000 10000 9000 Energy Son Drinks others to be pornity developed and started marketing a new wodt drink. The waters of the soft drink Lave skozcocketed und ESD as evaluating the decision to set up a new plant to which some of the eating production can be med The annual fixed con, the cost of production and the plant capacity for each of the ten plantation the shown in Table The distance in miles between the ten potential plants and the sis market (1 tonu 9 ta pilven in Tablo 2 Table 2 aluo show the demand for the mott drink at the site markets, 178 ur trucka for transporting the on, dried from the betting plant to the different market. These tracks have a capacity of 150 hecolher and incur an operating cost of $0.9% per min. Aber divery to the market, the treeply to the plant 1) Formule an integer inom programming model to minimize the site out for the supply chain network and to determine the rumber of paper and the locations of these plate. Make sure you chewy define the decision with the decis of your 2) the the folver functionality in inel solve the most. What we the location for the open pland what is the place of work? Are all open plants being dapat di plantas con capacity and what is the capacity available at the planet 5) Suppose that the maximum ditunet butween a plant and a market cannot exceed 150 miles What additionat decine vraties under constraints do you need to add to your model in querien 1) ecommodine this condition 4) Resolve the model developed in and identify the new plant location and the minimum cont 5) Identifyin aditional semario and develop model for the sono Anahe the model and in your model resul Table 1. ESDB's costs and capacity Plant Fixed cost in S) A 81400 B 83800 C 88600 D 91000 E 79000 F 86200 G 88600 H 91000 1 79000 J 80200 a hectoliters 100 liters Capacity (in hectoliters) 22000 24000 28000 30000 20000 26000 28000 30000 20000 21000 Production cost (5 hectoliter) 0.5 0.45 0.42 0.44 0.56 0.5 0.5 0.46 0.43 0.41 Table 2. Distance in miles between potential plants and markets 1 2 Markets 3 4 5 6 1394 772 D E Plants 0 76.1 20.8 547 13.5 30.4 139.4 47 72.6 117 76.1 0 92.9 113.3 55 71 772 106,5 1465 83.2 30,4 71 472 529 28 0 13.2 162 945 72.6 1445 47.5 93 673 945 2079 36.7 0 63.4 156.1 1872 148.7 1382 0 180 2 2079 1469 11.7 83,7 11.7 452 93 38.1 146.9 389 G 11 1 0 Demand 14000 10000 000 12000 10000 9000 Minnesota State University Moorhead Paseka School of Business MGMT/MKTG 419: SUPPLY CHAIN MANAGEMENT (3 credits) Energy Soft Drinks Bottler (ESDB) Case Study (Adopted from SSD case study of ODU ENMA 613: Logistics and Supply Chain Management) Energy Soft Drinks Bottler (ESDB) Inc. has recently developed and started marketing a new soft drink. The sales of the soft drink have sky-rocketed and ESDB is evaluating the decision to set up a new plant to which some of the existing production can be moved. The annual fixed cost, the cost of production and the plant capacity for each of the ten plant locations (A thru J) is shown in Table 1. The distance in miles between the ten potential plants and the six markets (1 thru 6) is given in Table 2. Table 2 also shows the demand for the soft drink at the six markets. ESDB uses trucks for transporting the soft drink from the bottling plant to the different markets. These trucks have a capacity of 150 hectoliters and incur an operating cost of $0.92 per mile. After delivery to the market, the trucks return empty to the plant. 1) Formulate an integer linear programming model to minimize the total cost for the supply chain network and to determine the number of plants to be opened and the locations of these plants. Make sure you clearly define the decision variables, the objective function and the constraints of your model. 2) Use the Solver functionality in Excel to solve the model. What are the locations for the open plants and what is the optimal total cost of the network? Are all open plants being used to full capacity? Which, if any plant has excess capacity and what is the excess capacity available at this plant? 3) Suppose that the maximum distance between a plant and a market cannot exceed 150 miles. What additional decision variables and/or constraints do you need to add to your model in question 1) to accommodate this condition? 4) Resolve the model developed in 3) and identify the new plant locations and the minimum cost. 5) Identify an additional scenario and develop a model for the scenario. Analyze the model and discuss your model results. Table 1. ESDB's costs and capacity Capacity Plant Fixed cost (in $) (in hectoliters) A 81400 22000 B 83800 24000 88600 28000 D 91000 30000 E 79000 20000 F 86200 26000 G 88600 28000 H 91000 30000 1 79000 20000 J 80200 21000 a hectoliter is 100 liters Production cost ($/hectoliter) 0.5 0.45 0.42 0.44 0.56 0.5 0.5 0.46 0.43 0.41 Table 2. Distance in miles between potential plants and markets Markets 1 2 3 4 5 6 A 0 76.1 30.4 139.4 72.6 11.7 B 76.1 0 71 77.2 144.5 83.7 20.8 92.9 47.2 156.1 47.5 11.7 D 54.7 93 113.3 13.5 52.9 85.5 187.2 28 45.2 67.3 E 148.7 Plants 9.3 F 30.4 71 0 138.2 94.5 38.1 146.9 G H 139.4 47.8 77.2 138.2 106.5 46.2 207.9 86.7 38.9 0 180.2 207.9 146.9 72.6 11.7 144.5 83.7 94.5 38.1 0 63.4 = 63.4 2 Demand 14000 10000 8000 12000 10000 9000
Step by Step Solution
There are 3 Steps involved in it

Get step-by-step solutions from verified subject matter experts