

Question: please solve using matlab! Plotting a graph using plot command & Plotting Multiple Curves in a plot 2.1 Suppose you have experimental data set such
please solve using matlab!
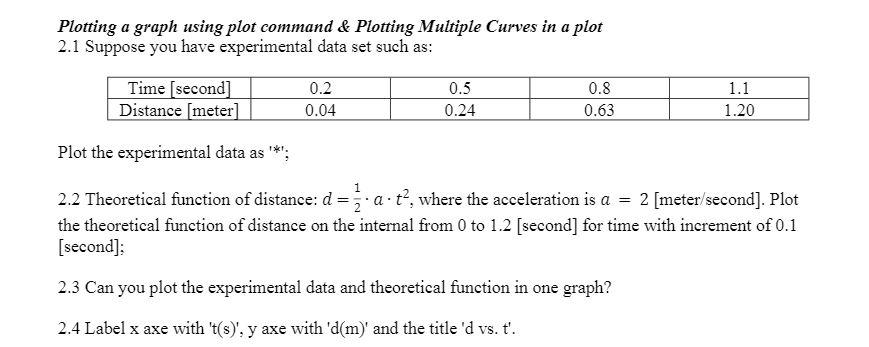
Plotting a graph using plot command & Plotting Multiple Curves in a plot 2.1 Suppose you have experimental data set such as: Time [second] Distance (meter) 0.2 0.04 0.5 0.24 0.8 0.63 1.1 1.20 Plot the experimental data as' 2.2 Theoretical function of distance: d = a.t?, where the acceleration is a = 2 [meter/second]. Plot the theoretical function of distance on the internal from 0 to 1.2 [second] for time with increment of 0.1 [second]; 2.3 Can you plot the experimental data and theoretical function in one graph? 2.4 Label x axe with 't(s)', y axe with 'd(m)' and the title 'd vs. t
Step by Step Solution
There are 3 Steps involved in it
1 Expert Approved Answer
Step: 1 Unlock

Question Has Been Solved by an Expert!
Get step-by-step solutions from verified subject matter experts
Step: 2 Unlock
Step: 3 Unlock