

Question: Please some one help me with these Histogram 2 3 Use the histogram below complete the statements. The mean of the data set is 45
Please some one help me with these
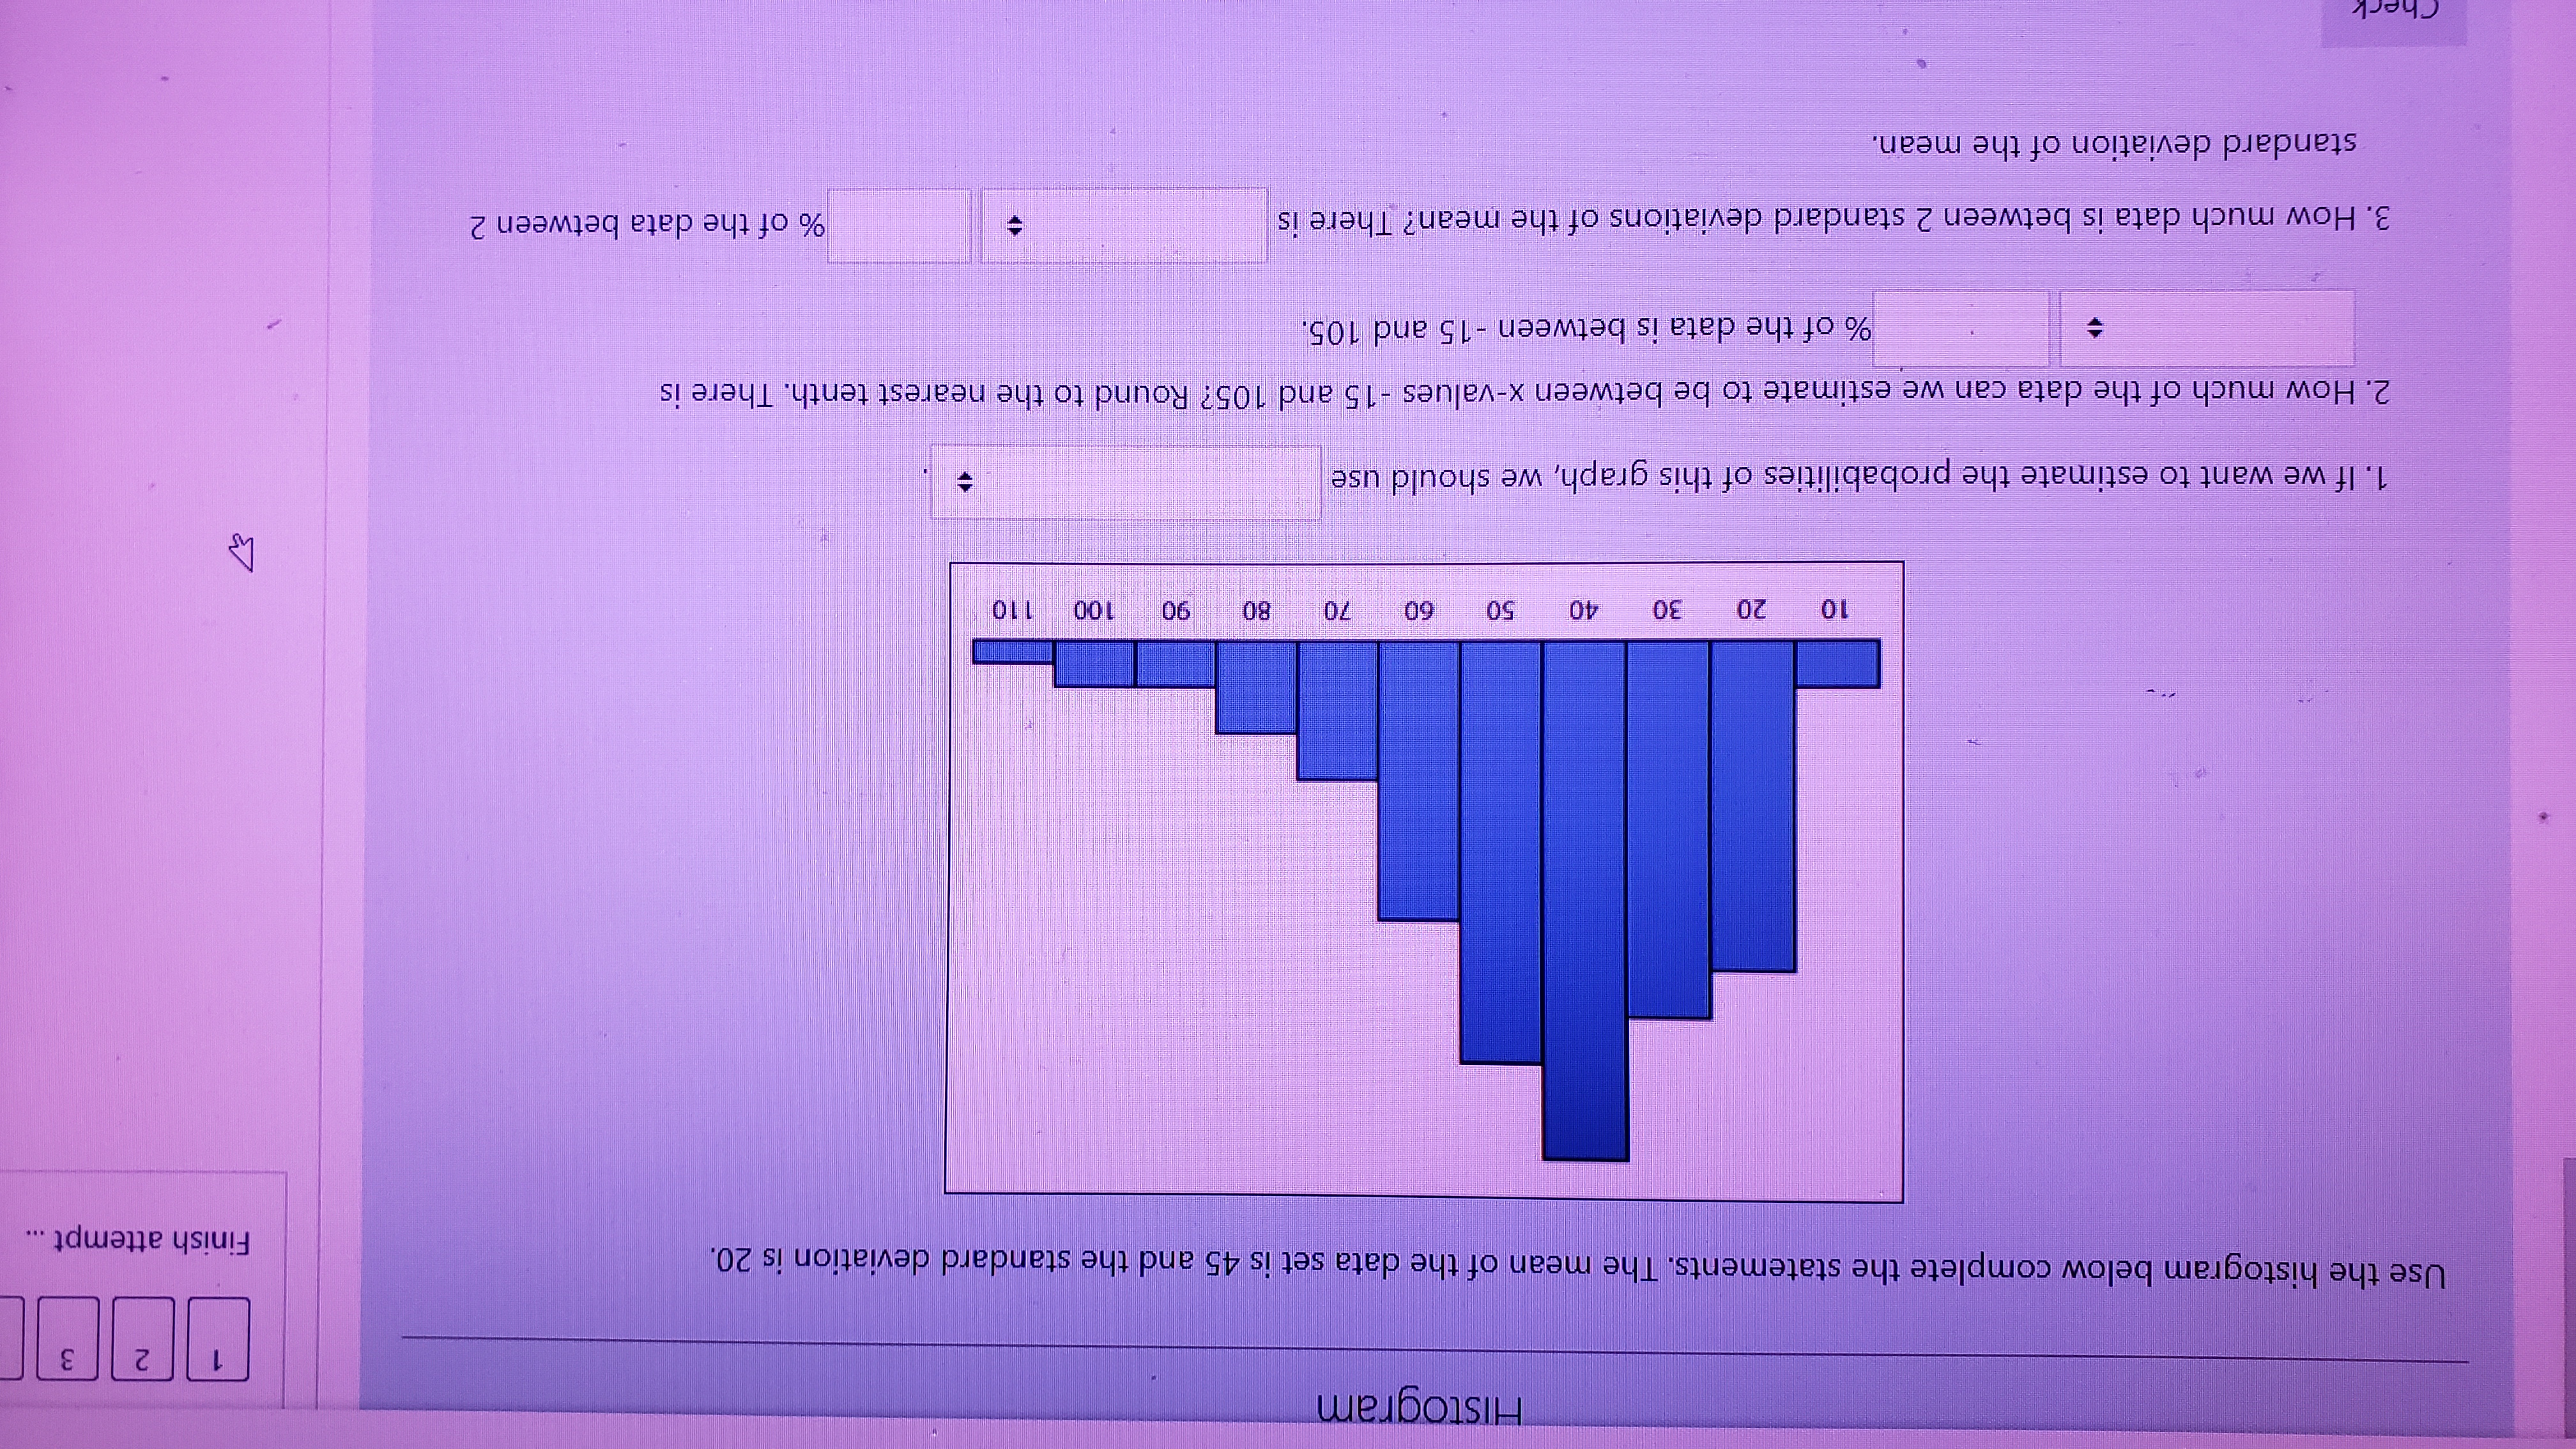
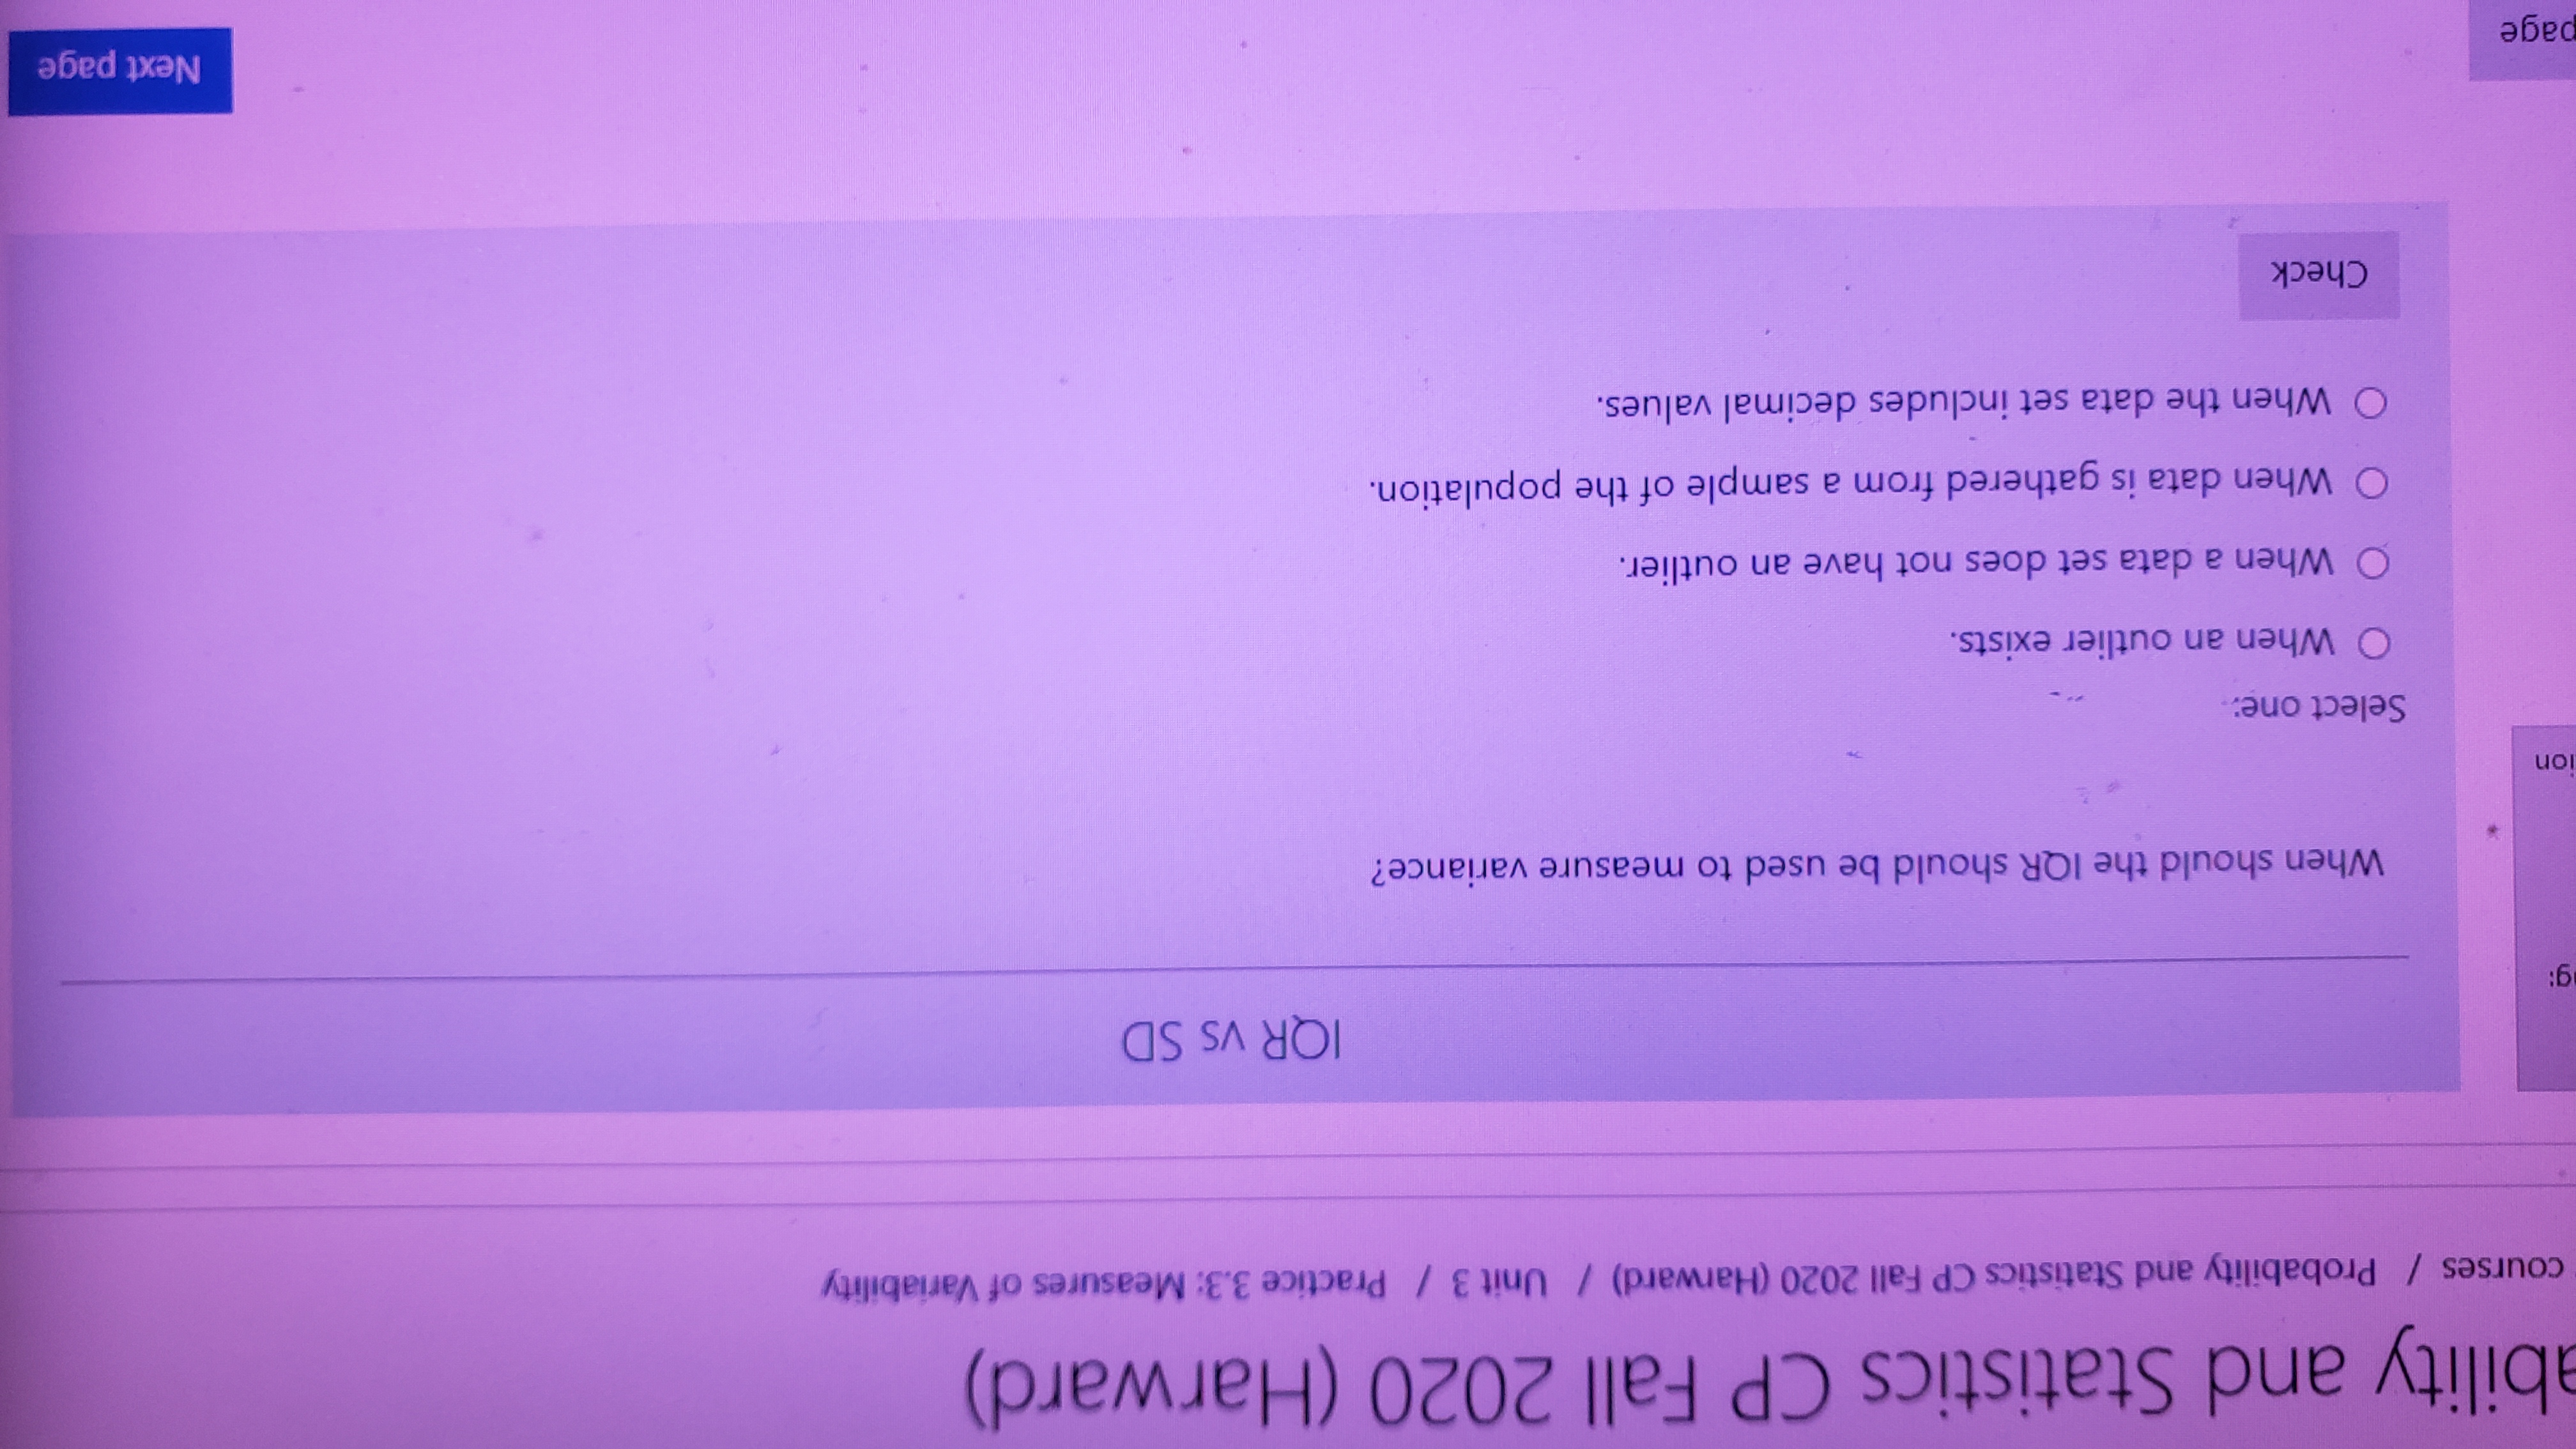
Histogram 2 3 Use the histogram below complete the statements. The mean of the data set is 45 and the standard deviation is 20. Finish attempt ... 10 20 30 40 50 60 70 80 90 100 110 1. If we want to estimate the probabilities of this graph, we should use 2. How much of the data can we estimate to be between x-values -15 and 105? Round to the nearest tenth. There is % of the data is between -15 and 105. 3. How much data is between 2 standard deviations of the mean? There is % of the data between 2 standard deviation of the mean.bility and Statistics CP Fall 2020 (Harward) courses / Probability and Statistics CP Fall 2020 (Harward) / Unit 3 / Practice 3.3: Measures of Variability IQR VS SD g: When should the IQR should be used to measure variance? ion Select one: O When an outlier exists. O When a data set does not have an outlier. O When data is gathered from a sample of the population. O When the data set includes decimal values. Check page Next page
Step by Step Solution
There are 3 Steps involved in it

Get step-by-step solutions from verified subject matter experts