

Question: please specify which answer is for which question.The firs pics are the problem and the pics that says (Q1,Q2,Qxxxx) are the questions ti be answered
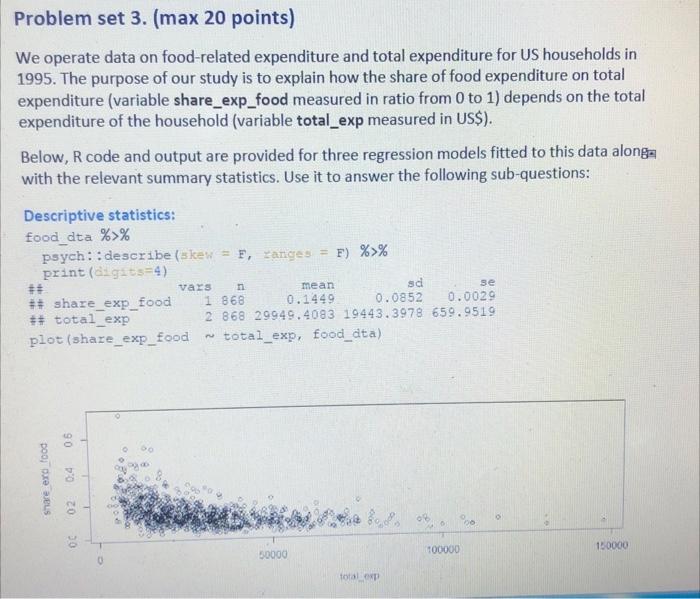
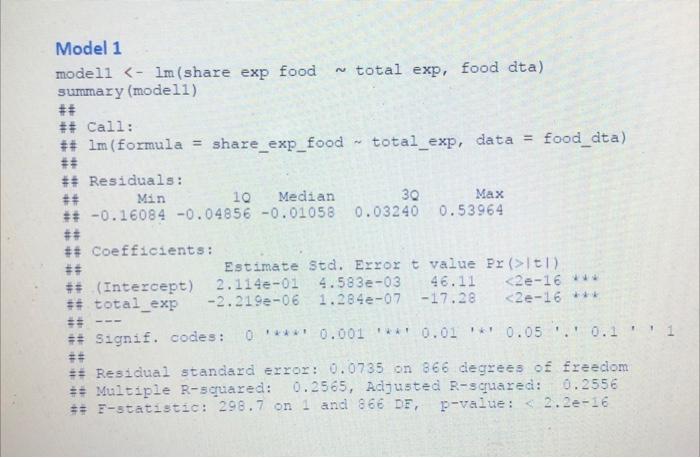
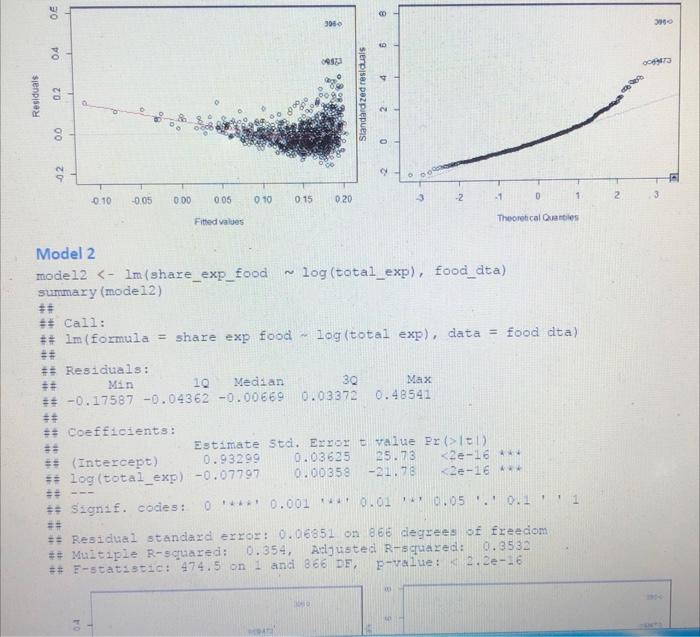
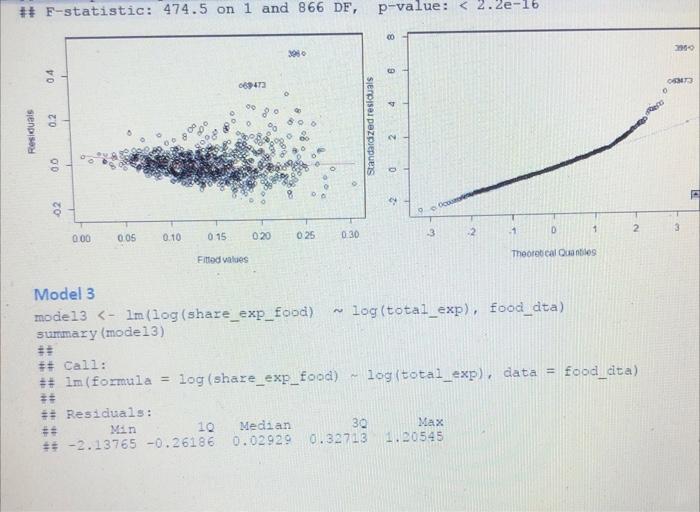
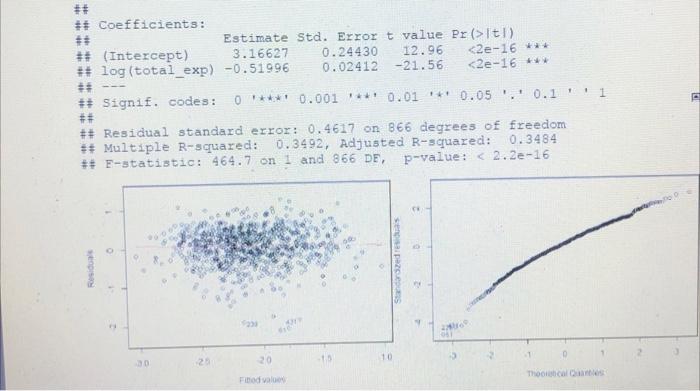

Problem set 3. (max 20 points) We operate data on food-related expenditure and total expenditure for US households in 1995. The purpose of our study is to explain how the share of food expenditure on total expenditure (variable share_exp_food measured in ratio from 0 to 1) depends on the total expenditure of the household (variable total_exp measured in US$). Below, R code and output are provided for three regression models fitted to this data alonga with the relevant summary statistics. Use it to answer the following sub-questions: Descriptive statistics: food_dta %>% psych:: describe (skew = F, ranges = F) %>% print (agets=4) ** sd *# share_exp_food 0.1449 0.0852 0.0029 ## total_exp 2 868 29949.4083 19443.3978 659.9519 plot (share_exp_food total_exp, food_dta) mean se vars n 1868 06 - DOG) OS po 02 08 00 100000 150000 50000 total ## Model 1 modell 101) ## (Intercept) 2.1144-01 4.583e-03 46.11 101) ** (Intercept) 0.93299 0.03625 25.73 It!) ** (Intercept) 3.16627 0.24430 12.96
Step by Step Solution
There are 3 Steps involved in it

Get step-by-step solutions from verified subject matter experts