Question: Please submit ONE copy through CANVAS for each group with all group members' first and last names listed on the Ist page. Please submit your
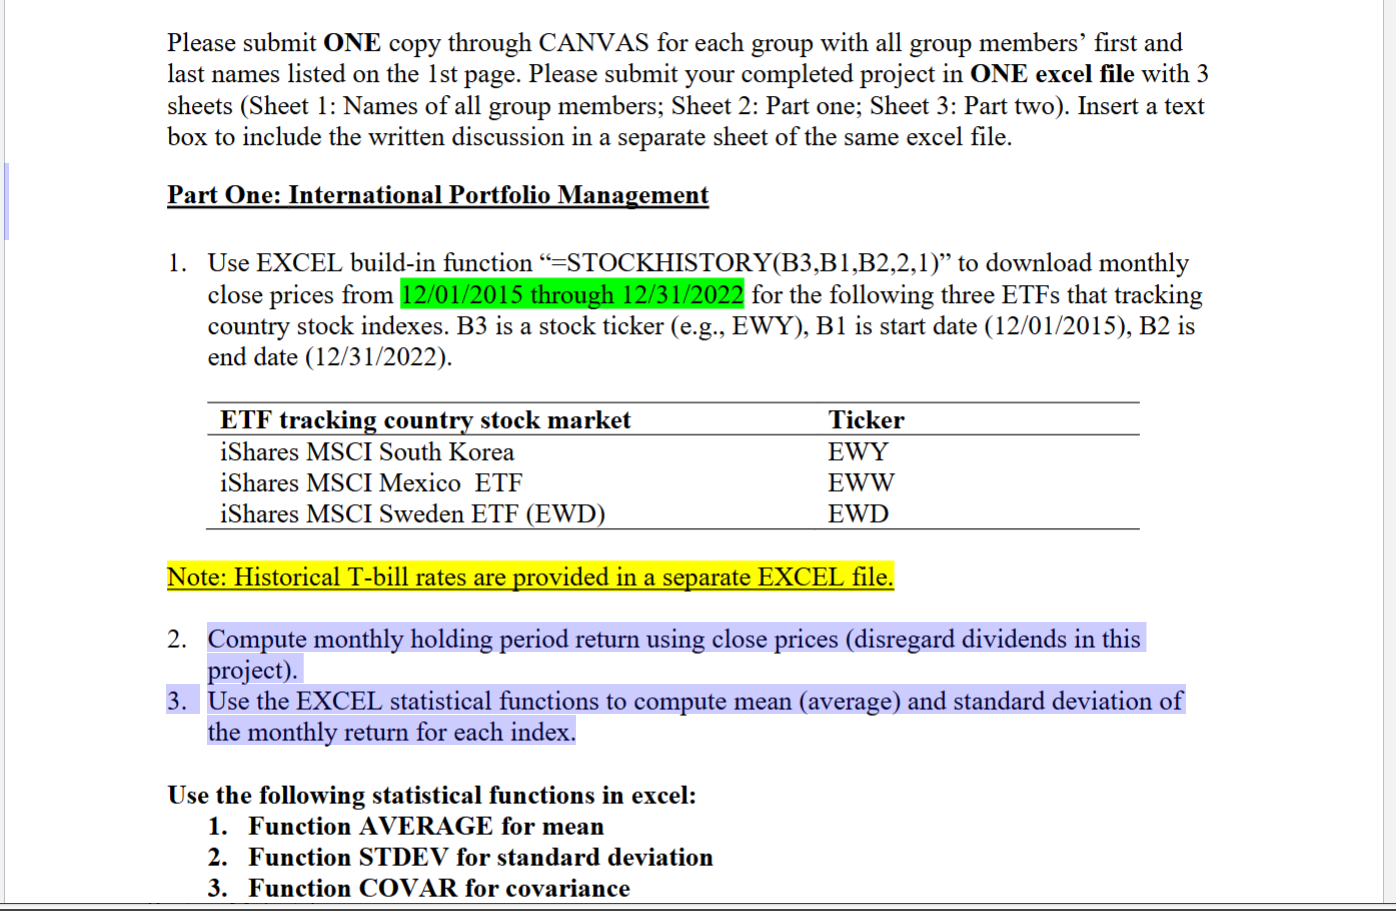
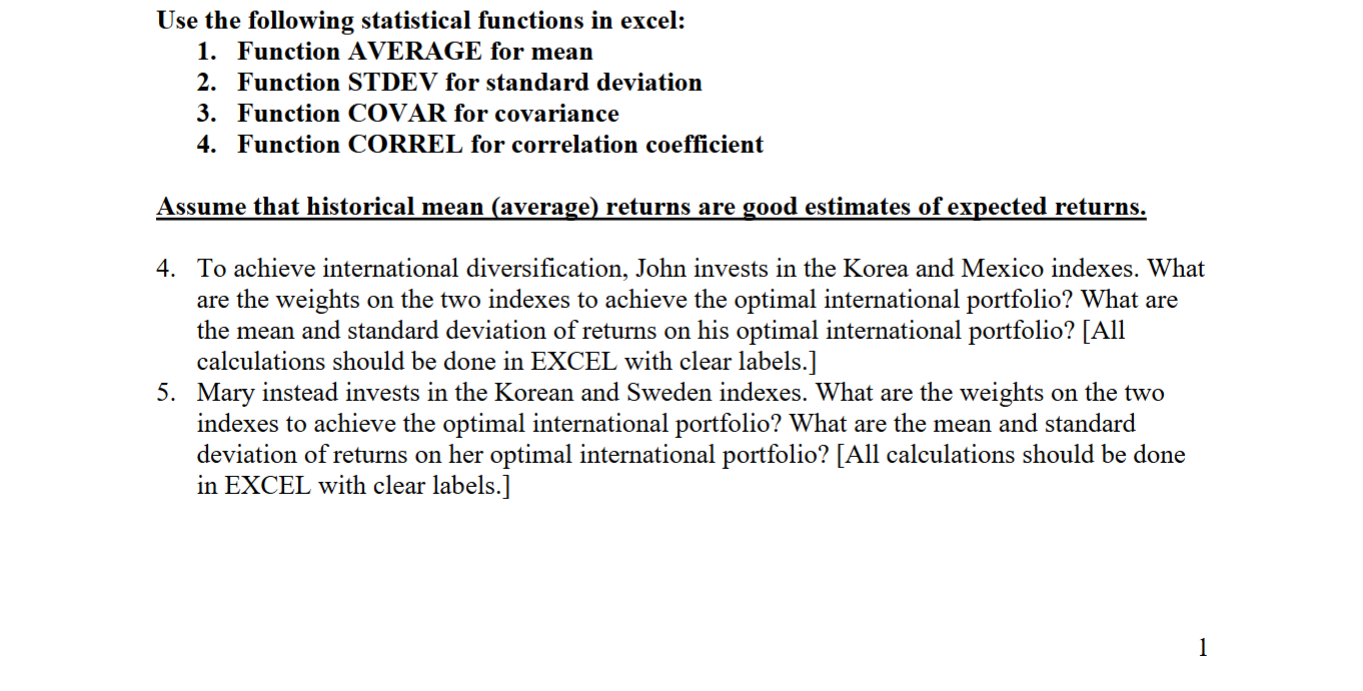
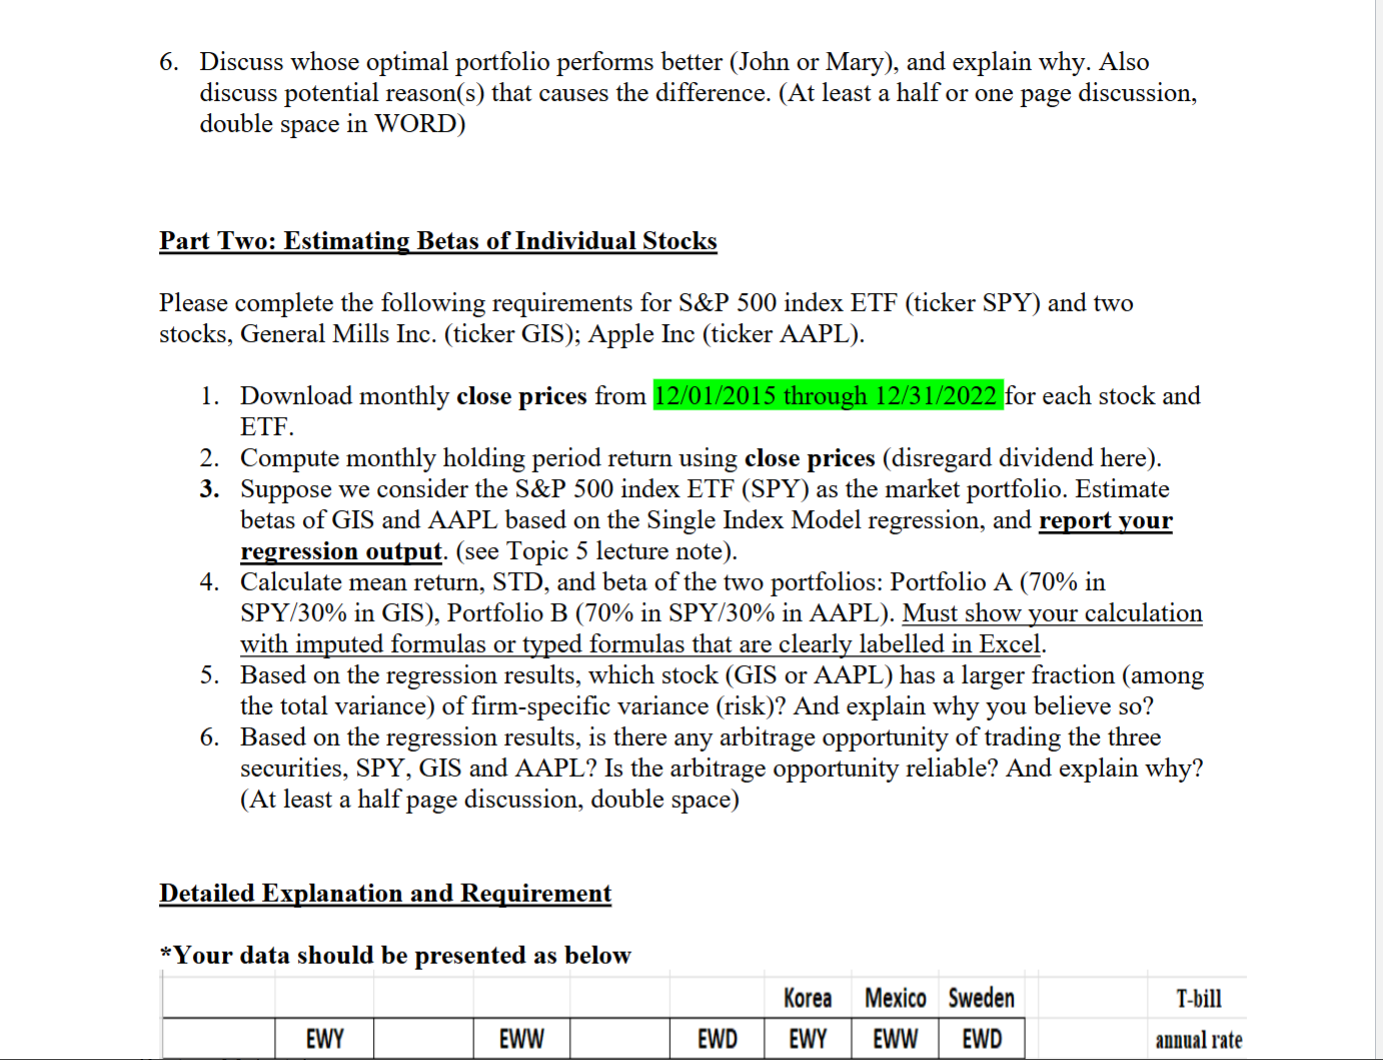
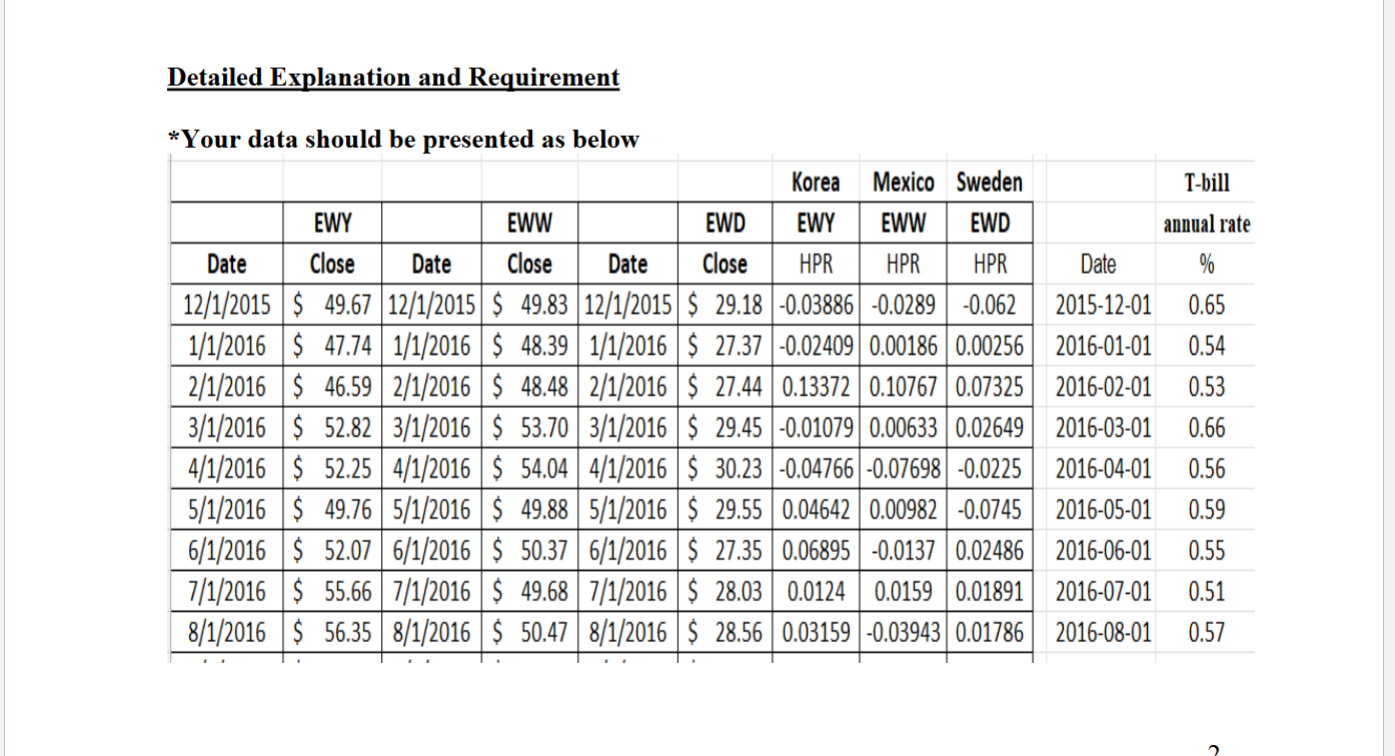
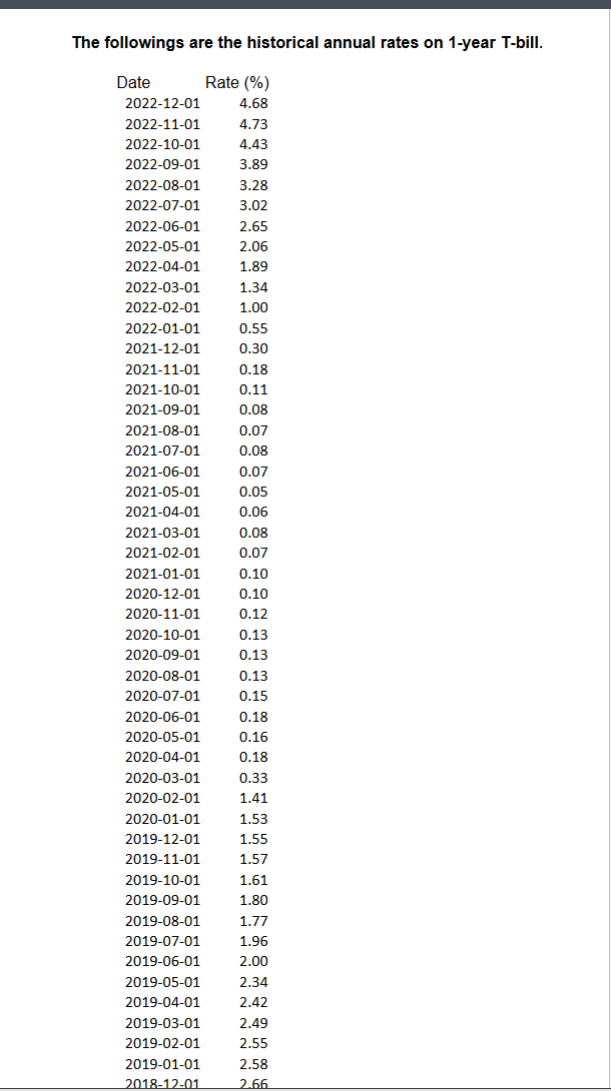
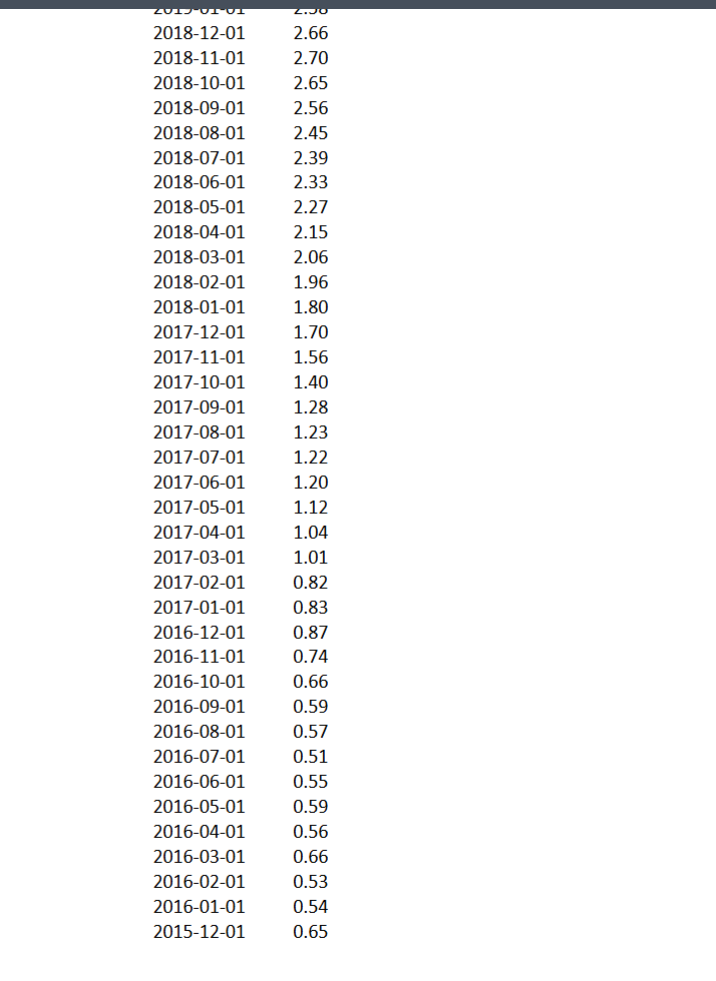
Please submit ONE copy through CANVAS for each group with all group members' first and last names listed on the Ist page. Please submit your completed project in ONE excel file with 3 sheets (Sheet 1: Names of all group members; Sheet 2: Part one; Sheet 3: Part two). Insert a text box to include the written discussion in a separate sheet of the same excel file. Part One: International Portfolio Management 1. Use EXCEL build-in function "=STOCKHISTORY(B3,B1,B2,2,1)" to download monthly close prices from 12/01/2015 through 12/31/2022 for the following three ETFs that tracking country stock indexes. B3 is a stock ticker (e.g., EWY), BI is start date (12/01/2015), B2 is end date (12/31/2022). ETF tracking country stock market Ticker iShares MSCI South Korea EWY iShares MSCI Mexico ETF EWW iShares MSCI Sweden ETF (EWD) EWD Note: Historical T-bill rates are provided in a separate EXCEL file. 2. Compute monthly holding period return using close prices (disregard dividends in this project). 3. Use the EXCEL statistical functions to compute mean (average) and standard deviation of the monthly return for each index. Use the following statistical functions in excel: 1. Function AVERAGE for mean 2. Function STDEV for standard deviation 3. Function COVAR for covarianceUse the following statistical functions in excel: - Function AVERAGE for mean . Function STDEV for standard deviation - Function COVAR for covariance . Function CORREL for correlation coefficient & whe Assume that historical mean (average) returns are good estimates of expected returns. 4. To achieve international diversification, John invests in the Korea and Mexico indexes. What are the weights on the two indexes to achieve the optimal international portfolio? What are the mean and standard deviation of returns on his optimal international portfolio? [All calculations should be done in EXCEL with clear labels. ] 5. Mary instead invests in the Korean and Sweden indexes. What are the weights on the two indexes to achieve the optimal international portfolio? What are the mean and standard deviation of returns on her optimal international portfolio? [All calculations should be done in EXCEL with clear labels. ] 6. Discuss whose optimal portfolio performs better (John or Mary), and explain why. Also discuss potential reason(s) that causes the difference. (At least a half or one page discussion, double space in WORD) Part Two: Estimating Betas of Individual Stocks Please complete the following requirements for S&P 500 index ETF (ticker SPY) and two stocks, General Mills Inc. (ticker GIS); Apple Inc (ticker AAPL). 1, 2: 3. Download monthly close prices from 12/01/2015 through 12/31/2022 for each stock and ETF. Compute monthly holding period return using close prices (disregard dividend here). Suppose we consider the S&P 500 index ETF (SPY) as the market portfolio. Estimate betas of GIS and AAPL based on the Single Index Model regression, and report your regression output. (see Topic 5 lecture note). Calculate mean return, STD, and beta of the two portfolios: Portfolio A (70% in SPY/30% in GIS), Portfolio B (70% in SPY/30% in AAPL). Must show your calculation with imputed formulas or typed formulas that are clearly labelled in Excel. Based on the regression results, which stock (GIS or AAPL) has a larger fraction (among the total variance) of firm-specific variance (risk)? And explain why you believe so? Based on the regression results, is there any arbitrage opportunity of trading the three securities, SPY, GIS and AAPL? Is the arbitrage opportunity reliable? And explain why? (At least a half page discussion, double space) Detailed Explanation and Requirement *Your data should be presented as below Korea Mexico Sweden T-bill annual rate Detailed Explanation and Requirement * Your data should be presented as below Korea Mexico Sweden T-bill EWY EWW EWD EWY EWW EWD annual rate Date Close Date Close Date Close HPR HPR HPR Date % 12/1/2015 $ 49.67 12/1/2015 $ 49.83 12/1/2015 $ 29.18 -0.03886 -0.0289 -0.062 2015-12-01 0.65 1/1/2016 $ 47.74 1/1/2016 $ 48.39 1/1/2016 $ 27.37 -0.02409 0.00186 0.00256 2016-01-01 0.54 2/1/2016 $ 46.59 2/1/2016 $ 48.48 2/1/2016 $ 27.44 0.13372 0.10767 0.07325 2016-02-01 0.53 3/1/2016 $ 52.82 3/1/2016 $ 53.70 3/1/2016 $ 29.45 -0.01079 0.00633 0.02649 2016-03-01 0.66 4/1/2016 $ 52.25 4/1/2016 $ 54.04 4/1/2016 $ 30.23 -0.04766 -0.07698 -0.0225 2016-04-01 0.56 5/1/2016 $ 49.76 5/1/2016 $ 49.88 5/1/2016 $ 29.55 0.04642 0.00982 -0.0745 2016-05-01 0.59 6/1/2016 $ 52.07 6/1/2016 $ 50.37 6/1/2016 $ 27.35 0.06895 -0.0137 0.02486 2016-06-01 0.55 7/1/2016 $ 55.66 7/1/2016 $ 49.68 7/1/2016 $ 28.03 0.0124 0.0159 0.01891 2016-07-01 0.51 8/1/2016 $ 56.35 8/1/2016 $ 50.47 8/1/2016 $ 28.56 0.03159 -0.03943 0.01786 2016-08-01 0.57The followings are the historical annual rates on 1-year T-bill. Date Rate (%) 2022-12-01 4.68 2022-11-01 4.73 2022-10-01 4.43 2022-09-01 3.89 2022-08-01 3.28 2022-07-01 3.02 2022-06-01 2.65 2022-05-01 2.06 2022-04-01 1.89 2022-03-01 1.34 2022-02-01 1.00 2022-01-01 0.55 2021-12-01 0.30 2021-11-01 0.18 2021-10-01 0.11 2021-09-01 0.08 2021-08-01 0.07 2021-07-01 0.08 2021-06-01 0.07 2021-05-01 0.05 2021-04-01 0.06 2021-03-01 0.08 2021-02-01 0.07 2021-01-01 0.10 2020-12-01 0.10 2020-11-01 0.12 2020-10-01 0.13 2020-09-01 0.13 2020-08-01 0.13 2020-07-01 0.15 2020-06-01 0.18 2020-05-01 0.16 2020-04-01 0.18 2020-03-01 0.33 2020-02-01 1.41 2020-01-01 1.53 2019-12-01 1.55 2019-11-01 1.57 2019-10-01 1.61 2019-09-01 1.80 2019-08-01 1.77 2019-07-01 1.96 2019-06-01 2.00 2019-05-01 2.34 2019-04-01 2.42 2019-03-01 2.49 2019-02-01 2.55 2019-01-01 2.58 2018-12-01 2.662018-12-01 2.66 2018-11-01 2.70 2018-10-01 2.65 2018-09-01 2.56 2018-08-01 2.45 2018-07-01 2.39 2018-06-01 2.33 2018-05-01 2.27 2018-04-01 2.15 2018-03-01 2.06 2018-02-01 1.96 2018-01-01 1.80 2017-12-01 1.70 2017-11-01 1.56 2017-10-01 1.40 2017-09-01 1.28 2017-08-01 1.23 2017-07-01 1.22 2017-06-01 1.20 2017-05-01 1.12 2017-04-01 1.04 2017-03-01 1.01 2017-02-01 0.82 2017-01-01 0.83 2016-12-01 0.87 2016-11-01 0.74 2016-10-01 0.66 2016-09-01 0.59 2016-08-01 0.57 2016-07-01 0.51 2016-06-01 0.55 2016-05-01 0.59 2016-04-01 0.56 2016-03-01 0.66 2016-02-01 0.53 2016-01-01 0.54 2015-12-01 0.65
Step by Step Solution
There are 3 Steps involved in it
1 Expert Approved Answer
Step: 1 Unlock
Question Has Been Solved by an Expert!
Get step-by-step solutions from verified subject matter experts
Step: 2 Unlock
Step: 3 Unlock
Students Have Also Explored These Related Finance Questions!