Question: Please Summarize below. Inventory-Driven Costs by Gianpaolo Callioni, Xavier de Montgros, Regine Slagmulder, Luk N. Van Wassenhove, and Linda Wright The 1990s were hard for
Please Summarize below.
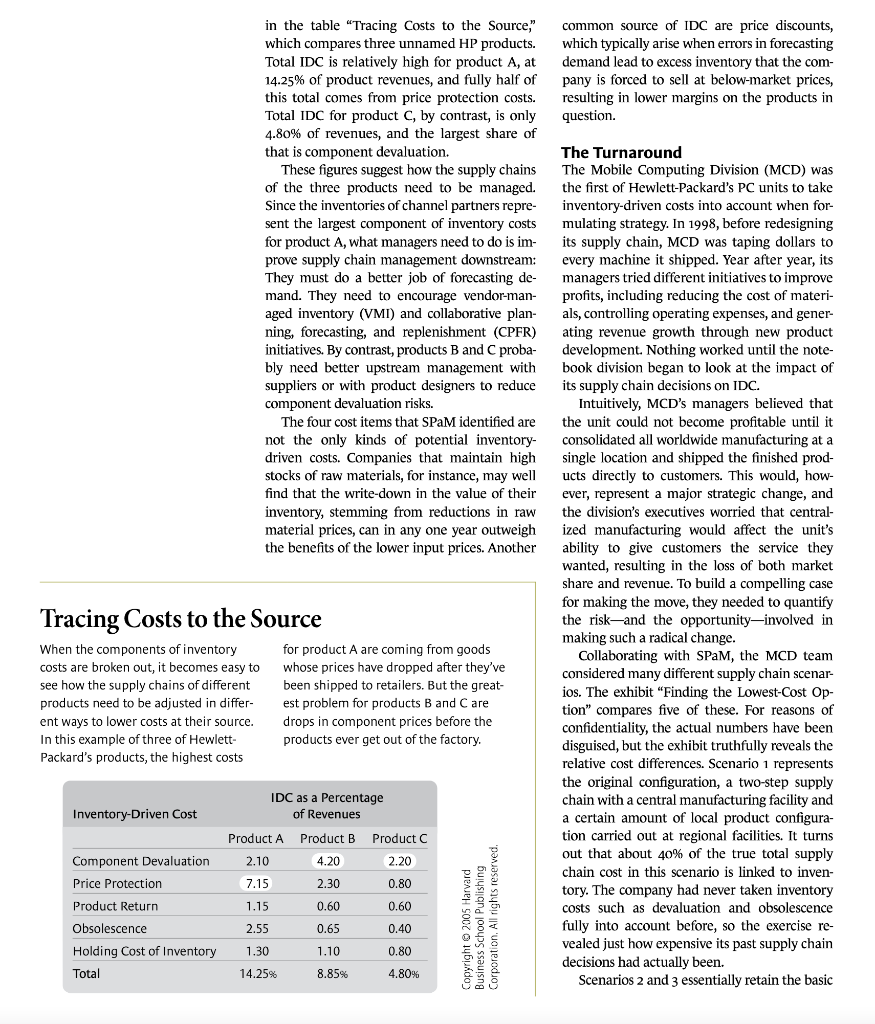
Inventory-Driven Costs by Gianpaolo Callioni, Xavier de Montgros, Regine Slagmulder, Luk N. Van Wassenhove, and Linda Wright The 1990s were hard for the PC business. Al- though demand grew fivefold between 1990 and 1997, the products had become household staples, and it was difficult for companies to differentiate their offerings. Hewlett-Packard came out better than many. The computer hardware giant slashed. prices on all of its PCs: 10% in 1991, another 26% in 1992, and yet another 22% in 1993. At the same time, it revamped its design, plan- ning, and production processes to shorten cycle times, respond quickly to changes in de- mand, and move inventory to the right loca- tion as it was needed. By late 1999, HP had dis- placed IBM as the world's third-largest PC manufacturer in terms of revenue, behind Dell and Compaq. But for all its success in maintaining market share, HP was struggling turn a dollar. By 1997, margins on its PCs were as thin as a sili- con wafer, and some product lines had not turned a profit since 1993. Price cuts made for- merly insignificant costs critical-computer manufacturers simply could not stock up on components or any other inventory. Any ex- cess at the end of a product's short life had to be written off, further eroding margins. Add- ing to the pressure, constant technology ad- vances made new products obsolete in as few as six months. A common rule of thumb was that the value of a fully assembled PC de- creased at the rate of 1% a week. Although HP's supply chains were flexible and respon- sive enough to deliver the PCs when and where customers wanted them, they were not economically sustainable. Compounding the problem, company exec- utives realized, was the fact that HP's manage- ment-accounting metrics had failed to keep pace with the evolution of its supply chains. HP now oversaw a complex, multitiered manu- facturing network made up of many disparate entities. But the company's current approach to cost measurement allowed individual play- ers in the chain to see only their piece of the puzzle, making it impossible for them to assess the overall dollar impact of their local deci- sions. They could not see the effects of opera- e nd 0 ros the r of ine or e tional decisions like setting the size of buffer inventory between two sections of the produc- tion process. Nor could they assess the impact of such strategic decisions as choosing to locate a final assembly plant close to a particular sup- plier. If the company wanted to design sustain- able supply chains, it needed to give all its managers a direct line of sight to the overall bottom line. The Hidden Cost of Inventory To make the PC business more cost competi- tive, HP's Strategic Planning and Modeling (SPAM) group, led by Corey Billington, under- took an exhaustive review of the PC business's overall cost structure in 1997. It soon became clear that mismatches between demand and supply leading to excess inventory were the main drivers of PC costs; in 1995, for example, costs related to inventory had equaled the PC business's total operating margin. It was just as clear that the division's existing cost metrics did not track all of HP's inventory-driven costs (IDC), pieces of which were often mixed in with other cost items, scattered different functions and geographic locations, and re- corded at different times using different ac- counting conventions. The most readily identifiable component of inventory-driven costs is the traditional inven- tory cost item, usually defined as the "holding cost of inventory," which covers both the capi- tal cost of money tied up in inventory and the physical costs of having inventory (warehouse space costs, storage taxes, insurance, rework, breakage, spoilage). At HP, however, the hold- ing cost accounted for less than 10% of total in- ventory-driven costs. SPaM's investigation re- vealed four other inventory-driven cost items at HP's PC business. And each of them needed to be managed in a distinct way. Component Devaluation Costs. According to SPAM's calculations, these accounted for the lion's share of HP's inventory costs. Key components such as microprocessor chips and memory typically drop in price quickly and steeply. The price of a CPU, for instance, might fall as much as 40% during its nine-month life cycle, and the penalties for holding excess parts when a price drop occurred could be enormous. Back in 1997, however, few elec- tronic hardware makers had realized just how perishable their goods had become, and HP, in common with many others, maintained inven- tory in several places-in factories and distri- bution centers, in merge centers, in transit. Every time the component prices fell, HP was hit with another devaluation cost at each of these points in the value chain. HP had no control over component prices, but it could control how much inventory it was holding. That meant reducing the number of nodes in the supply chain, consolidating manu- facturing facilities, taking possession of compo- nents on a just-in-time basis, paying the going price at that time, and working with suppliers to minimize inventory when a price drop was anticipated. Price Protection Costs. If HP dropped the market price of a product after units had al- ready been shipped to a sales channel, it had to reimburse its channel partners for the differ- ence for any units that had not yet sold, so the channel partner didn't have to sell at a loss. Given how quickly value decayed, this mis- matched inventory exposed HP to big price protection risks. A channel partner might buy a product from HP when the prevailing market price was $1,000. But if the item sold five weeks later at a new price of $950, HP had to reim- burse the $50 difference. To limit this cost, HP had to be certain that channel partners' inven- tory never exceeded the minimum number of days required to ensure the desired availability, so that no excess inventory had to be protected. This meant that Hewlett-Packard had to keep its manufacturing turnaround times short and replenishment cycles frequent. HP also offered its channel partners incentives to carry the lower levels of inventory. Analysis showed that the cost of these incentives was almost always lower than the cost of reimbursing channel partners after price breaks. Product Return Costs. In a sense, product return costs are simply 100% price protection costs; distributors can simply return unsold goods to the manufacturer for a full refund. In some cases, product returns constituted more than 10% of the product's revenue, not be- cause of product failures but because resellers were returning excess inventory. Apart from incurring the perational costs (shipping, han- dling, product retesting, and the like), returns lengthened the time a product spent in the supply chain before reaching an end user, in- creasing HP's exposure to additional devalua- tion risks and inventory finance costs. To man- age this type of inventory-driven cost, HP had Excess inventory was the main driver of Hewlett- Packard's PC costs; one year, in fact, inventory- driven costs equaled the PC business's total operating margin. to work closely with channel partners to opti- mize the whole supply chain. By agreeing with its channel partners on specific inventory lev- els and delivery expectations, HP reduced inef- ficient inventory in the channel and increased its overall quality of service both to partners and end customers. Obsolescence Costs. End-of-life write-offs were initially the most obvious portion of this cost. PC life cycles being so short, even a small miscalculation in anticipated demand could leave the company holding stacks of worthless goods that had to be written off. The other re- lated but sometimes less obvious components of obsolescence costs were discounts on about- to-be-discontinued products and the associ ated marketing effort required to accelerate their sale. These costs are typically not in- cluded in a company's cost of goods sold and, although HP executives took these discounts and marketing costs into account when mak- ing decisions about discontinuing product lines, they seldom considered them when de- termining the real cost of inventory. To avoid obsolescence costs, HP had to be very efficient in managing product introductions, so that new models were launched just as the last re- maining units of the old models sold out. On the whole, calculating these compo- nents of inventory costs is fairly straightfor- ward. The simplest to determine is devalua- tion, which can be figured by multiplying the inventory level of the product or component in question by the proper devaluation rate. Suppose that a hypothetical company sells a consumer electronic item that devalues at a yearly rate of 60%. Average annual inventory related to the product is worth $200 million, and annual revenues from selling the product are $1 billion. Then, the yearly inventory- related cost due to product devaluation is the average annual inventory multiplied by the devaluation rate, or $120 million. Dividing that figure by revenues gives us the cost as a margin, in this case 12%. Clearly, at any given devaluation rate, inventory costs will increase directly as inventory increases. The faster prices fall, the more the inventory-driven costs rise as inventory increases. Since in most cases the devaluation rate is outside manage- rial control, the only way to reduce the im- pact of devaluation on profits is to do a better job of matching demand and supply, thereby shrinking inventories. Price protection and return costs are calcu- lated in a similar way, but the actual sums are somewhat more complicated because they de- pend on the contractual agreements set up be- tween manufacturers and distributors. In its simplest case, if a manufacturer has agreed to reimburse its distributors 100% whenever it lowers its list price, the formula for determin- ing price protection costs is the price drop times the number of units of the product in distributors' inventory. Similarly, return costs would be the number of items returned of a particular product times the wholesale price paid by the retailer in the first place. But those sums need to be adjusted by the contract terms, which might, for example, not allow all inventory to be returned if the retailer deliber- ately overstocks. (The more generous the price- protection and return terms, the less the dis- tributor will lose by doing so.) What's more, contract enforcement may depend on specific circumstances. For example, even if the con- tract constrains the return options of the chan- nel partner, HP may still agree to take prod- ucts back to maintain good relations and secure future sales. Devaluation, price protection, and return costs are essentially continuous costs; they occur all the time and can be calculated at any point. Obsolescence costs, however, are dis- crete, arising only when a company decides to retire a particular product and therefore can- not be estimated until that moment. The amount of obsolescence costs is determined by several factors. First, the company needs to write off 100% of the value of finished goods in its inventories (less any recycling or scrap ben- efits). Then it must write down the value of any components in the pipeline. If compo- nents are product specific, they will have to be written off 100%; those that can be used else- where will be subject to devaluation costs de- pending on how quickly they can be trans- ferred to other products. Finally, the company has to add in the related marketing and dis- counting costs of selling off about-to-be discon- tinued products in fire sales. As important as identifying the various hidden components of inventory costs was to HP, even more powerful was understanding how the impact of each IDC component dif- fered for different products. That had pro- found implications for the way HP managed its product portfolio. This insight is illustrated in the table "Tracing Costs to the Source," which compares three unnamed HP products. Total IDC is relatively high for product A, at 14.25% of product revenues, and fully half of this total comes from price protection costs. Total IDC for product C, by contrast, is only 4.80% of revenues, and the largest share of that is component devaluation. These figures suggest how the supply chains of the three products need to be managed. Since the inventories of channel partners repre- sent the largest component of inventory costs for product A, what managers need to do is im- prove supply chain management downstream: They must do a better job of forecasting de- mand. They need to encourage vendor-man- aged inventory (VMI) and collaborative plan- ning, forecasting, and replenishment (CPFR) initiatives. By contrast, products B and C proba- bly need better upstream management with suppliers or with product designers to reduce component devaluation risks. The four cost items that SPAM identified are not the only kinds of potential inventory- driven costs. Companies that maintain high stocks of raw materials, for instance, may well find that the write-down in the value of their inventory, stemming from reductions in raw material prices, can in any one year outweigh the benefits of the lower input prices. Another for product A are coming from goods whose prices have dropped after they've been shipped to retailers. But the great- est problem for products B and C are drops in component prices before the products ever get out of the factory. IDC as a Percentage of Revenues Product B Product C 4.20 2.20 2.30 0.80 0.60 0.60 0.65 0.40 1.10 0.80 4.80% 8.85% Tracing Costs to the Source When the components of inventory costs are broken out, it becomes easy to see how the supply chains of different products need to be adjusted in differ- ent ways to lower costs at their source. In this example of three of Hewlett- Packard's products, the highest costs Inventory-Driven Cost Product A Component Devaluation 2.10 Price Protection 7.15 Product Return 1.15 Obsolescence 2.55 Holding Cost of Inventory 1.30 Total 14.25% Copyright 2005 Harvard Business School Publishing Corporation. All rights reserved. common source of IDC are price discounts, which typically arise when errors in forecasting demand lead to excess inventory that the com- pany is forced to sell at below-market prices, resulting in lower margins on the products in question. The Turnaround The Mobile Computing Division (MCD) was the first of Hewlett-Packard's PC units to take inventory-driven costs into account when for- mulating strategy. In 1998, before redesigning its supply chain, MCD was taping dollars to every machine it shipped. Year after year, its managers tried different initiatives to improve profits, including reducing the cost of materi- als, controlling operating expenses, and gener- ating revenue growth through new product development. Nothing worked until the note- book division began to look at the impact of its supply chain decisions on IDC. Intuitively, MCD's managers believed that the unit could not become profitable until it consolidated all worldwide manufacturing at a single location and shipped the finished prod- ucts directly to customers. This would, how- ever, represent a major strategic change, and the division's executives worried that central- ized manufacturing would affect the unit's ability to give customers the service they wanted, resulting in the loss of both market share and revenue. To build a compelling case for making the move, they needed to quantify the risk and the opportunity-involved in making such a radical change. Collaborating with SPAM, the MCD team considered many different supply chain scenar- ios. The exhibit "Finding the Lowest-Cost Op- tion" compares five of these. For reasons of confidentiality, the actual numbers have been disguised, but the exhibit truthfully reveals the relative cost differences. Scenario 1 represents the original configuration, a two-step supply chain with a central manufacturing facility and a certain amount of local product configura- tion carried out at regional facilities. It turns out that about 40% of the true total supply chain cost in this scenario is linked to inven- tory. The company had never taken inventory costs such as devaluation and obsolescence fully into account before, so the exercise re- vealed just how expensive its past supply chain decisions had actually been. Scenarios 2 and 3 essentially retain the basic two-step supply chain configuration of sce- nario 1 but assume that the company will limit inventory costs by putting more-efficient man- ufacturing processes in place and by passing on to supply chain partners as much responsibil- ity as possible for inventories. As the exhibit shows, these nonstrategic changes would suf- fice to reduce total costs (including IDC) by as much as 24%. In scenarios and 5, the unit considered radically restructuring its supply chain, and either approach would involve major strategic changes to implement. Both are essentially one-step supply chains, but there the similarities end. Scenario 4 assumes that HP would have several regional factories doing both manufacturing and localized con- figurations. In scenario 5, however, everything would be done in a single central factory and airfreighted directly to customers worldwide. What this means is that scenario 4 has higher manufacturing costs than scenario 5 but lower freight costs. How should the Mobile Computing Divi- sion choose between the scenarios? In terms of manufacturing costs only, scenario 5, which MCD called International Direct Ship, is the best option, suggesting that the company should consider making the radical change to a one-step supply chain. Factoring in freight, the one-step model remains the theoretically opti- mal supply chain, although scenario 4, with re- gional factories, now appears to be the best op- tion. But the case for switching to a one-step model is considerably undermined because scenario 3, the best-case two-step option, is now only one percentage point more expen- Costs Relative to Scenario 1 TRADITIONAL COSTS Manufacturing Distribution Scenario 1 100% 100% 100% Freight Total costs w/o IDC 100% IDC COSTS 100% Inventory finance Inventory devaluation 100% Inventory obsolescence 100% IDC total 100% Total costs w/ IDC 100% Finding the Lowest-Cost Option Breaking out inventory-driven costs gave HP's Mobile Computing Division a far more comprehensive understanding of the various supply chain options it was considering. Sce- nario 1 represents the existing cost structure of the unit's business in 1998, in which prod- ucts were manufactured centrally and config- ured to conform to local needs in regional markets. Scenario 5 is the centralized one- step manufacturing model that HP eventu- ally adopted. Its merits do not become appar- ent until inventory-driven costs are taken into account. sive than scenario 4 and actually cheaper than scenario 5. The one percentage point differ- ence is not enough to make up for the organi- zational and financial changes that switching to a one-step supply chain would involve, de- spite the tight margins on the PC business. But what a different picture emerges when IDCs such as inventory devaluation and obso- lescence costs are fully quantified and included in the analysis. Then, the case for switching to a one-step supply chain looks much stronger. Even if the company were to exploit all the possible opportunities for reducing IDC in the current supply chain structure, as scenario 3 rather unrealistically assumes, both one-step scenarios come out about four percentage points cheaper, which is enough to justify management's case for switching to a one-step supply chain. A full assessment of IDC, there- fore, not only revealed the limitations of MCD's current supply chain but also provided strong evidence that the only way the division could turn its business around was by refash- ioning its entire supply chain strategy. IDC considerations also drove the choice be- tween the unit's two very different one-step supply chain alternatives. As the exhibit shows, the total cost difference between them, when IDCs were taken into account, was minimal (0.2 percentage points). But managers felt that scenario 4 offered many opportunities for losing control of inventory-driven costs, and it was not clear that MCD would always be able to contain those risks. Managing a multitude of regional factories with separate pools of materials and products is harder than Scenario 4. Scenario 5 Scenario 2 no change Scenario 3 -15.6% -11.1% -21.0% no change no change no change no change +7.4% -28.4% +56.8% no change no change -9.2% -10.2% -6.7% -29.6% -44.4% -51.9% 55.7% 58.0% 63.5% -18.5% 51.6% -24.0% -34.9% 19.2% 29.3% 52.7% 58.1% 43.6% 51.2% -15.5% -24.0% -28.1% -28.3% Copyright 2005 Harvard Business School Publishing Corporation. All rights reserved. managing just the one. More factories would mean greater chances that capacity would fall idle; several plants would certainly require higher levels of capital investment than a sin- gle one. And when MCD introduced new products, several factories would have to ramp up their production processes, not just one. So, although scenarios 4 and 5 seemed to be very similar in terms of base-case total costs, the Mobile Computing Division eventu- ally plumped for scenario 5. MCD started reaping the benefits almost at once. Inventory-driven costs dropped from 18.7% of total revenue in 1997 to 12.2% in 1998. In 1999, the division saw an even more dra- matic improvement, as IDC dropped to a mere 3.8% of revenue. These reductions translated directly into savings for the notebook division's bottom line, which in 1998 broke even and in 1999 turned profitable. The IDC metrics en- abled the Mobile Computing Division to clearly identify exactly where changes to its supply chain were needed and to justify changes that, according to more traditional thinking, would not have made sense. Other PC units, notably the commercial Linking Inventory Costs to Financial Performance Hewlett-Packard is finding that return on net assets (RONA) is a more accurate measure of shareholder value than market share, be- cause in such price-sensitive industries, the key to financial health is not revenue growth but sound asset management. To measure RONA accurately, companies need to track more than just traditional inventory costs. Those costs affect expenses only, but the price protection and product return costs that inventory-driven cost metrics track can also erode revenues. What's more, lowering Inventory-driven costs Price protection Product return Return on Net Assets Revenues Requirement Days Days Receivables. Inventory Outstanding Outstanding Days Payables Outstanding Obsolescence Expenses Fixed Assets desktop business, started to follow MCD's ap- proach to costing in their supply chain deci- sions, with similarly impressive results. In- spired by these successes, HP decided to officially implement the new metrics in all of its PC operations. In the first stage of the roll- out, the focus was on tracking IDC across all di- visions. In some cases, the information had to be assembled manually; in others, it was possi- ble to automate the data gathering. In the next stage, goals for each IDC line item were set for each region and product line, based on projects that were known to be in the works and estimates of future market conditions. A consistent presentation of the data was almost as important as the actual data. HP's regional units, product divisions, and finance groups worked closely together to develop a standard template for supply chain metrics, making sure that the data could be collected in the re- quested format for each line item in a timely manner. So everyone uses the same line items. on their spreadsheets, each with the same defi- nition, the same source of information, and the same method of calculation. As a result, all users can look at a line item and know exactly inventory-driven costs can not only decrease total costs and raise revenues but also lower working capital requirements by reducing the number of days of inventory outstanding. Component devaluation Traditional inventory costs Copyright 2005 Harvard Business School Publishing Corporation. All rights reserved. where the data came from and what they re- ally mean. The Payoff HP can now manage the profitability of its value chain in a much more sophisticated way. Gone are the days of across-the-board mea- sures like "Everyone must cut inventories by 20% by the end of the year," which would usu- ally result in a sometimes counterproductive flurry of cookie-cutter lean production and just-in-time initiatives. Now each product group is free to choose the supply chain con- figuration that best suits its needs as long as it meets the global IDC target. Product group managers may well have known before, on an intuitive level, what they needed to do, but the IDC metrics have made it easier for them to convince senior managers that their particular situations require particular solutions. Incorporating the IDC metrics into decision making has also saved managers from moves that make perfect sense for their own unit but add to overall costs. Previously, for example, a manager might have decided against shipping goods by air because the extra transportation costs would have exceeded the identifiable cost of financing and warehousing local inventory. But that decision would have imposed costs elsewhere in the supply chain, which might well have exceeded the extra transportation costs. Without measuring total IDC, there was no way to know that, and even if the manager made the right decision, he would probably have been penalized for it. Now, however, he would be rewarded for incurring extra local cost in the interests of reducing total costs. The IDC metrics are valuable in a whole range of R&D and marketing decisions. Many downstream supply chain costs arise because of choices managers make upstream in the product design phase. The IDC discipline has made HP's product designers much more aware of the consequences of their decisions, which makes them more responsible and ac- countable. Before, someone who had specified a hard drive that took three months to obtain would probably not have realized that during those months HP was liable for excess inven- tory, devaluation, and obsolescence costs. Now, such a designer no longer has that excuse. The IDC metrics also help managers decide how much flexibility to build into new products. In the past, HP often underestimated the related supply chain costs of offering lots of product features. Being able to quantify the real inven- tory-driven cost of adding, say, Lithuanian lan- guage customization to a product helps in de- termining whether or not to offer customers that option. But perhaps the greatest benefit of the IDC metrics is that they link operational decisions to corporate goals for creating shareholder value. In the new profit-focused climate, HP has been abandoning its traditional financial-performance metric of return on sales in favor of return on net assets (RONA). This reflects the competitive reality that, for companies like HP, advantage derives less from market share than from how efficiently the firm manages its assets-in other words, its supply chain. As the exhibit "Linking Inventory Costs to Financial Performance" shows, the relationship between inventory- driven costs and return on net assets is direct, simple, and powerful, which makes it far easier to align the interests and decisions of managers up and down the hierarchy. The financial benefits have come quickly. HP's Personal Systems Group, for example, saw worldwide inventory decline by 50% between 2000 and 2002, and it has maintained that level ever since. Costs associated with inventory have dropped even further, by some 70%. Since HP's merger with Compaq in May 2002, the push to adopt IDC companywide has moved forward. At this point, all of HP has adopted a standard set of inventory-driven cost metrics. Hewlett-Packard isn't the only company, of course, that operates in a dynamic, highly price-competitive industry. Consumer elec- tronics, fashion producers, and fresh-goods re- tailers all face similar challenges. Any com- pany with low margins, short life cycles, highly perishable or seasonal products, and unpre- dictable demand needs to track the various components of its inventory-driven costs. Without appropriate performance metrics to help visualize the magnitude of their supply chain problems and to prompt people to take action, these firms will simply not know if they are leaving hefty piles of money on the table. Reprint R0503J To order, see the next page or call 800-988-0886 or 617-783-7500 or go to www.hbr.org


