

Question: Please take the Data below and analyze it all into a few paragraphs that explain everything in word. W12-13-14: Walmart Loblaws Variance Analysis Comments 2022-01-31
Please take the Data below and analyze it all into a few paragraphs that explain everything in word.
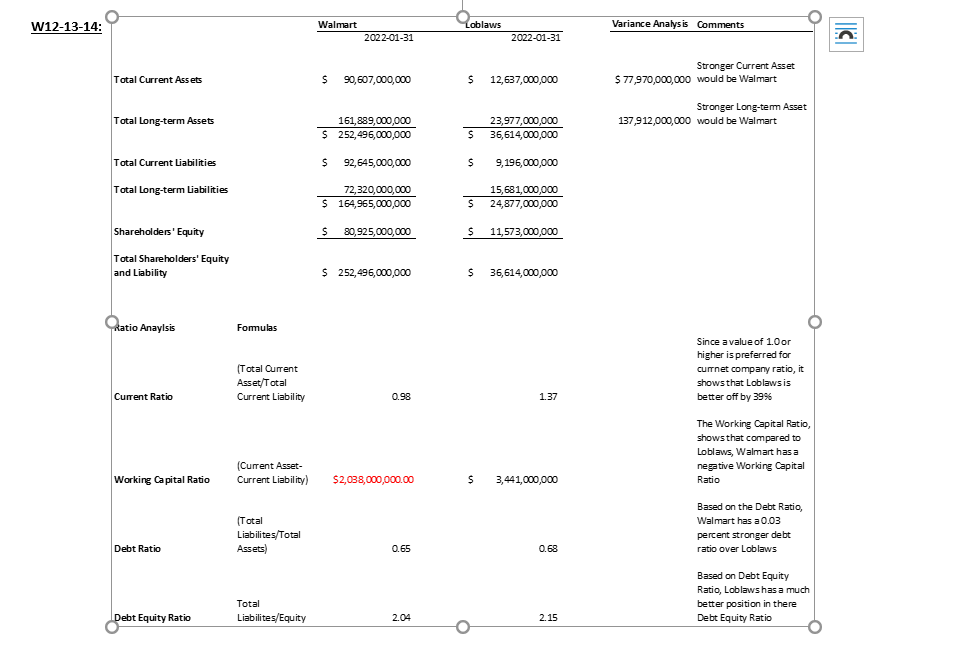
W12-13-14: Walmart Loblaws Variance Analysis Comments 2022-01-31 2022-01-31 C Total Current Assets $ 90,607,000,000 S 12,637,000,000 Stronger Current Asset $ 77,970,000,000 would be Walmart Stronger Long-term Asset 137,912,000,000 would be Walmart Total Long-term Assets 161,889,000,000 $ 252,496,000,000 S 23,977,000,000 36, 614,000,000 S 92,645,000,000 S 9,196,000,000 Total Current Liabilities Total Long-term Liabilities 72,320,000,000 $ 164,965,000,000 15,681,000,000 24,877,000,000 $ 80,925,000,000 11,573,000,000 Shareholders' Equity Total Shareholders' Equity and Liability $ 252,496,000,000 $ 36,614,000,000 Ratio Anayisis Formulas (Total Current Asset/Total Current Liability Since a value of 1.0 or higher is preferred for currnet company ratio, it shows that Loblaws is better off by 39% Current Ratio 0.98 1.37 The Working Capital Ratio, shows that compared to Loblaws, Walmart has a negative Working Capital Ratio Working Capital Ratio (Current Asset- Current Liability) $2,038,000,000.00 un 3,441,000,000 (Total Liabilites/Total Assets Based on the Debt Ratio, Walmart has a 0.03 percent stronger debt ratio over Loblaws Debt Ratio 0.65 0.68 Based on Debt Equity Ratio, Loblaws has a much better position in there Debt Equity Ratio Total Liabilites/Equity Debt Equity Ratio 2.04 2.15
Step by Step Solution
There are 3 Steps involved in it

Get step-by-step solutions from verified subject matter experts