Question: ***PLEASE TAKE YOUR TIME, CAN YOU PLEASE SHOW STEP-BY-STEP IN AN EXCEL SPREADSHEET and show the EXCEL FORMULAS IN THE SPREADSHEET, THANK YOU :)*** Sales

***PLEASE TAKE YOUR TIME, CAN YOU PLEASE SHOW STEP-BY-STEP IN AN EXCEL SPREADSHEET and show the EXCEL FORMULAS IN THE SPREADSHEET, THANK YOU :)***

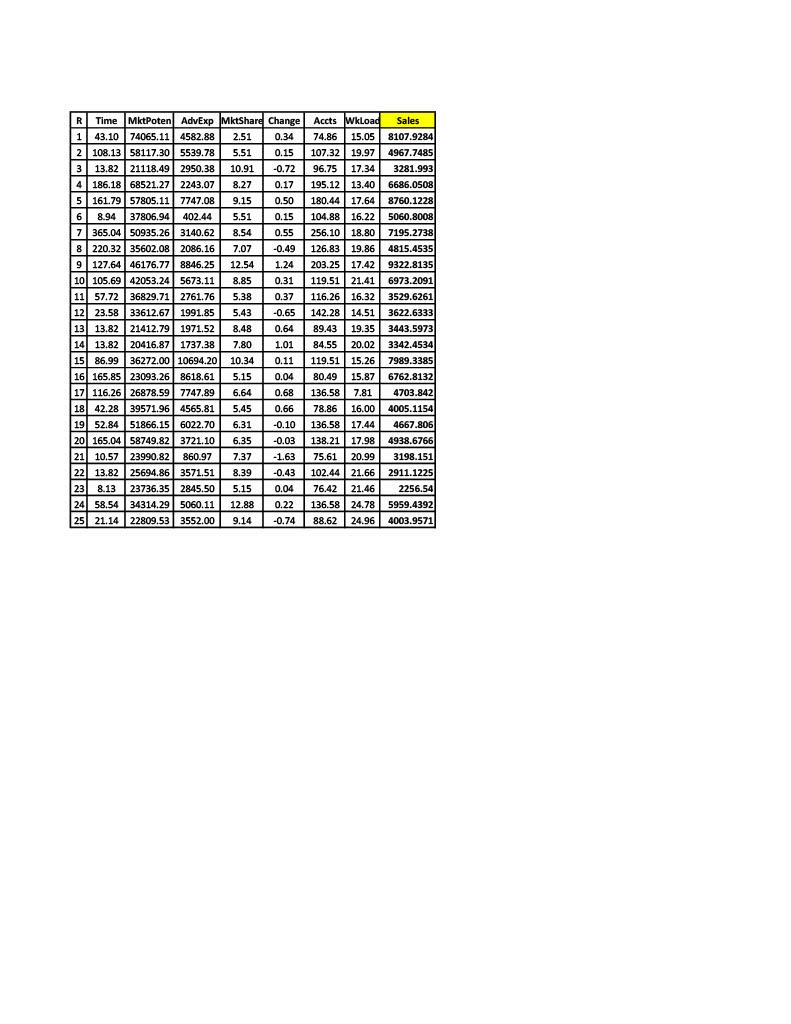
Sales manager of a company wishes to evaluate the performance of the companys sales representatives. Each sales rep. is solely responsible for one sales territory, and the manager decides that it is reasonable to measure performance, Y, of a sales rep. by using the yearly sales of the company product in the representatives sales territory. The manager feels that sales performance substantially depends on seven independent variables:

Time: Number of months the rep. has been employed by the company

MktPoten: Sales of the companys company and competing products in the sales territory, a measure of sales potential

AdvExp: Advertising expenditure in the territory

MktShare: weighted average of the companys market share in the territory for the previous four years

Change: Change in the companys market share in the territory over the previous four years

Accts: Number of accounts handled by representative

WkLoad: Average workload per account based on sizes of order and other workload related criteria

Sales: The dependent variable indicating number of units sold

a) Make scatter plot of all variables against Sales (Y-axis). Find the best fitted linear equation and R2 for all 7 scatter plots and explain any significant relationship you may observe.

b) Make a correlation coefficient matrix of all 8 variables. Rank variables based on their level of correlation (absolute value) with Sales.

c) Construct a full 7 variable regression model and formulate model equation to predict sales. Observe Multiple R, R-squared, Significant F, P-values and interpret. Rank the P-values of all 7 independent variables based on the degree of contribution to the model (highest to lowest contribution.)

***PLEASE TAKE YOUR TIME, CAN YOU PLEASE SHOW

\begin{tabular}{|c|c|c|c|c|c|c|c|c|} \hline R & Time & MktPoten & AdvExp & MktShare & Change & Accts & WkLoad & Sales \\ \hline 1 & 43.10 & 74065.11 & 4582.88 & 2.51 & 0.34 & 74.86 & 15.05 & 8107.9284 \\ \hline 2 & 108.13 & 58117.30 & 5539.78 & 5.51 & 0.15 & 107.32 & 19.97 & 4967.7485 \\ \hline 3 & 13.82 & 21118.49 & 2950.38 & 10.91 & 0.72 & 96.75 & 17.34 & 3281.993 \\ \hline 4 & 186.18 & 68521.27 & 2243.07 & 8.27 & 0.17 & 195.12 & 13.40 & 6686.0508 \\ \hline 5 & 161.79 & 57805.11 & 7747.08 & 9.15 & 0.50 & 180.44 & 17.64 & 8760.1228 \\ \hline 6 & 8.94 & 37806.94 & 402.44 & 5.51 & 0.15 & 104.88 & 16.22 & 5060.8008 \\ \hline 7 & 365.04 & 50935.26 & 3140.62 & 8.54 & 0.55 & 256.10 & 18.80 & 7195.2738 \\ \hline 8 & 220.32 & 35602.08 & 2086.16 & 7.07 & 0.49 & 126.83 & 19.86 & 4815.4535 \\ \hline 9 & 127.64 & 46176.77 & 8846.25 & 12.54 & 1.24 & 203.25 & 17.42 & 9322.8135 \\ \hline 10 & 105.69 & 42053.24 & 5673.11 & 8.85 & 0.31 & 119.51 & 21.41 & 6973.2091 \\ \hline 11 & 57.72 & 36829.71 & 2761.76 & 5.38 & 0.37 & 116.26 & 16.32 & 3529.6261 \\ \hline 12 & 23.58 & 33612.67 & 1991.85 & 5.43 & 0.65 & 142.28 & 14.51 & 3622.6333 \\ \hline 13 & 13.82 & 21412.79 & 1971.52 & 8.48 & 0.64 & 89.43 & 19.35 & 3443.5973 \\ \hline 14 & 13.82 & 20416.87 & 1737.38 & 7.80 & 1.01 & 84.55 & 20.02 & 3342.4534 \\ \hline 15 & 86.99 & 36272.00 & 10694.20 & 10.34 & 0.11 & 119.51 & 15.26 & 7989.3385 \\ \hline 16 & 165.85 & 23093.26 & 8618.61 & 5.15 & 0.04 & 80.49 & 15.87 & 6762.8132 \\ \hline 17 & 116.26 & 26878.59 & 7747.89 & 6.64 & 0.68 & 136.58 & 7.81 & 4703.842 \\ \hline 18 & 42.28 & 39571.96 & 4565.81 & 5.45 & 0.66 & 78.86 & 16.00 & 4005.1154 \\ \hline 19 & 52.84 & 51866.15 & 6022.70 & 6.31 & 0.10 & 136.58 & 17.44 & 4667.806 \\ \hline 20 & 165.04 & 58749.82 & 3721.10 & 6.35 & 0.03 & 138.21 & 17.98 & 4938.6766 \\ \hline 21 & 10.57 & 23990.82 & 860.97 & 7.37 & 1.63 & 75.61 & 20.99 & 3198.151 \\ \hline 22 & 13.82 & 25694.86 & 3571.51 & 8.39 & 0.43 & 102.44 & 21.66 & 2911.1225 \\ \hline 23 & 8.13 & 23736.35 & 2845.50 & 5.15 & 0.04 & 76.42 & 21.46 & 2256.54 \\ \hline 24 & 58.54 & 34314.29 & 5060.11 & 12.88 & 0.22 & 136.58 & 24.78 & 5 \end{tabular}

Step by Step Solution

There are 3 Steps involved in it

1 Expert Approved Answer
Step: 1 Unlock blur-text-image
Question Has Been Solved by an Expert!

Get step-by-step solutions from verified subject matter experts

Step: 2 Unlock
Step: 3 Unlock

Students Have Also Explored These Related General Management Questions!