

Question: Please teach me how to code number 8 a,b,c, and d Consider the differential equation Section 2.2 in Boyce A DiPrima) Solve it using dsolve
Please teach me how to code number 8 a,b,c, and d
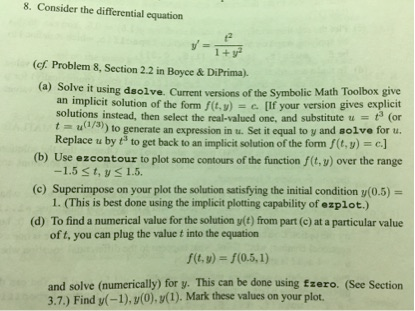
Consider the differential equation Section 2.2 in Boyce A DiPrima) Solve it using dsolve Current versions of the Symbolic Math Toolbox give an implicit solution of the form f(t.y) = e. [If your version gives explicit solutions instead, then select the real-valued one. and substitute u = t^3 (or t = u ^(1/3>) to generate an expression m u. Set it equal to y and solve for u. Replace u by t^3 to get back to an implicit solution of the form f(t. y) = c.] Use ezcontour to plot some contours of the function f(t, y) over the range -1.5 t, y 1.5. Superimpose on your plot the solution satisfying the initial condition y(0.5) = 1. (This is best done using the implicit plotting capability of ezplot.) To find a numerical value for the solution p(t) from pan (c) at a particular value of t, you can plug the value t into the equation f(t, y) = f(0.5,1) and solve (numerically) for y. This can be done using fzero. (See Section 3.7.) Find y(-1), y(0). y (1) Mark these valucs on your plot. Consider the differential equation Section 2.2 in Boyce A DiPrima) Solve it using dsolve Current versions of the Symbolic Math Toolbox give an implicit solution of the form f(t.y) = e. [If your version gives explicit solutions instead, then select the real-valued one. and substitute u = t^3 (or t = u ^(1/3>) to generate an expression m u. Set it equal to y and solve for u. Replace u by t^3 to get back to an implicit solution of the form f(t. y) = c.] Use ezcontour to plot some contours of the function f(t, y) over the range -1.5 t, y 1.5. Superimpose on your plot the solution satisfying the initial condition y(0.5) = 1. (This is best done using the implicit plotting capability of ezplot.) To find a numerical value for the solution p(t) from pan (c) at a particular value of t, you can plug the value t into the equation f(t, y) = f(0.5,1) and solve (numerically) for y. This can be done using fzero. (See Section 3.7.) Find y(-1), y(0). y (1) Mark these valucs on your plot
Step by Step Solution
There are 3 Steps involved in it

Get step-by-step solutions from verified subject matter experts