

Question: Please tell me if I have the wrong answer selected and how to find the correct answer. Also, please tell me what the correct answer
Please tell me if I have the wrong answer selected and how to find the correct answer. Also, please tell me what the correct answer is. Thank you so much.
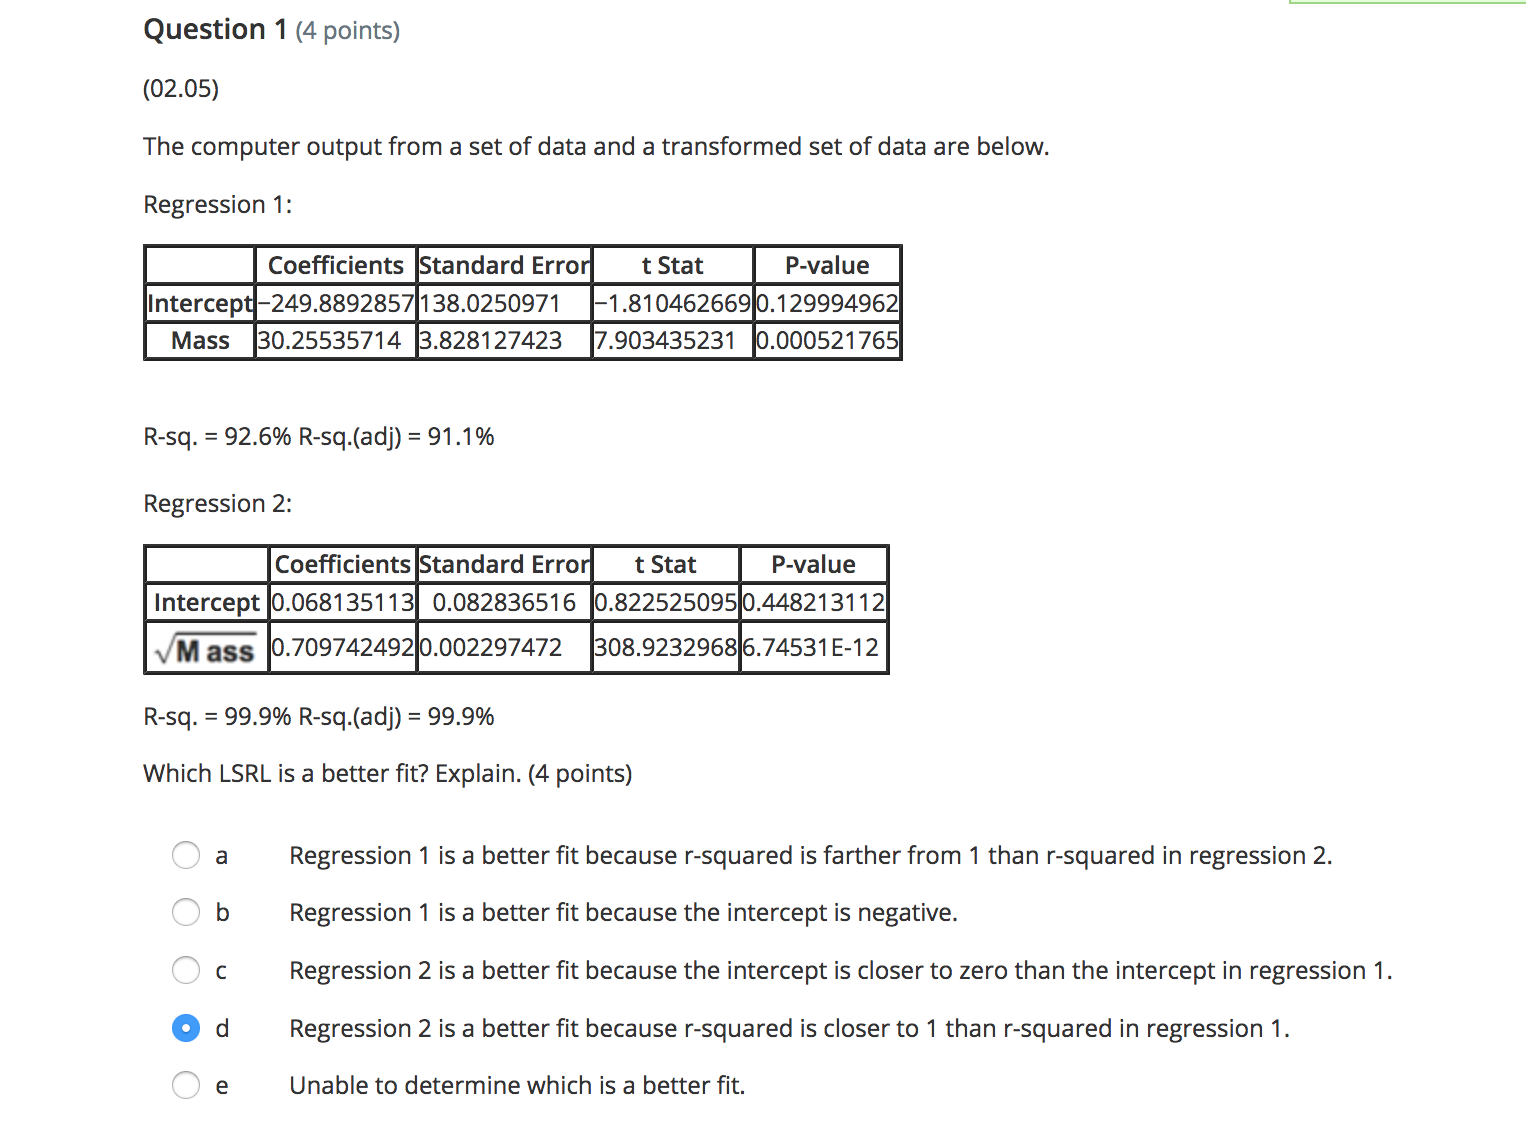
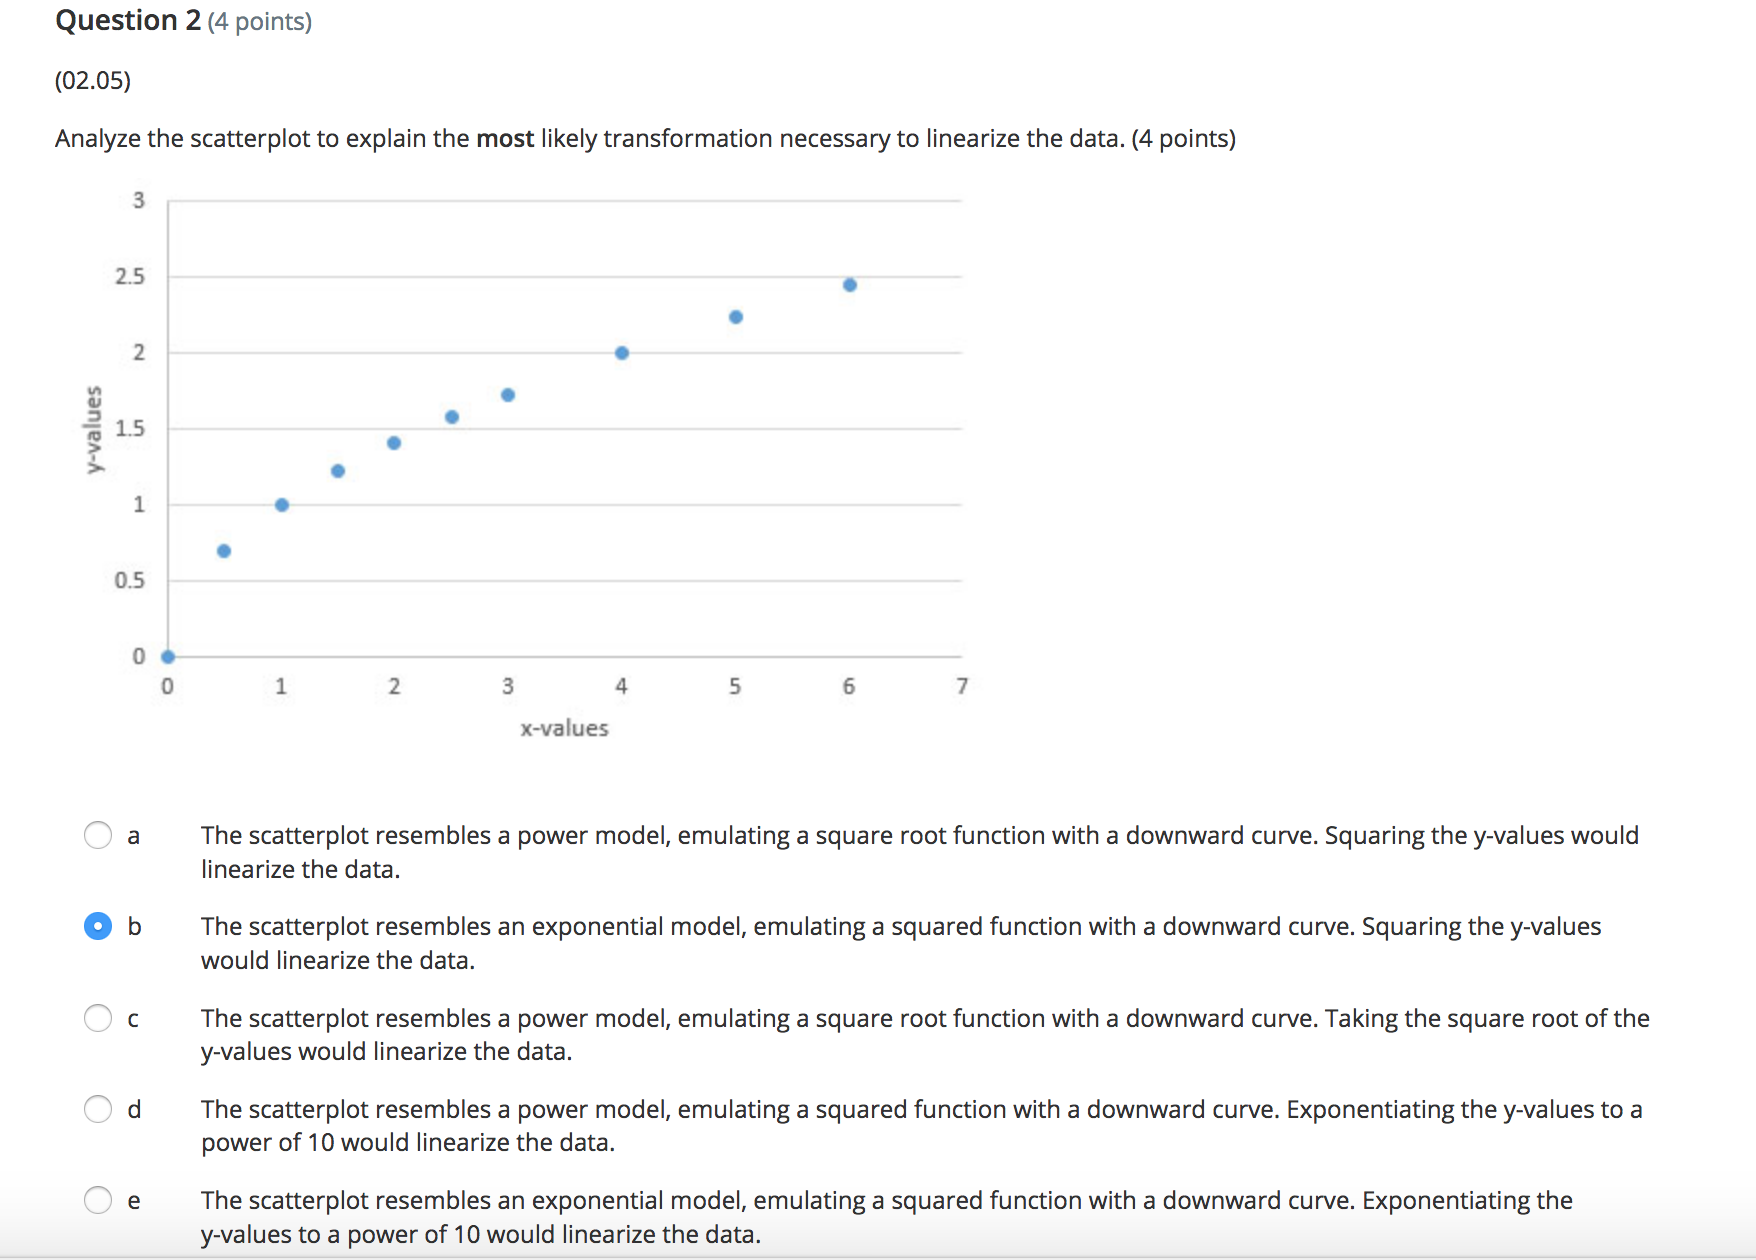
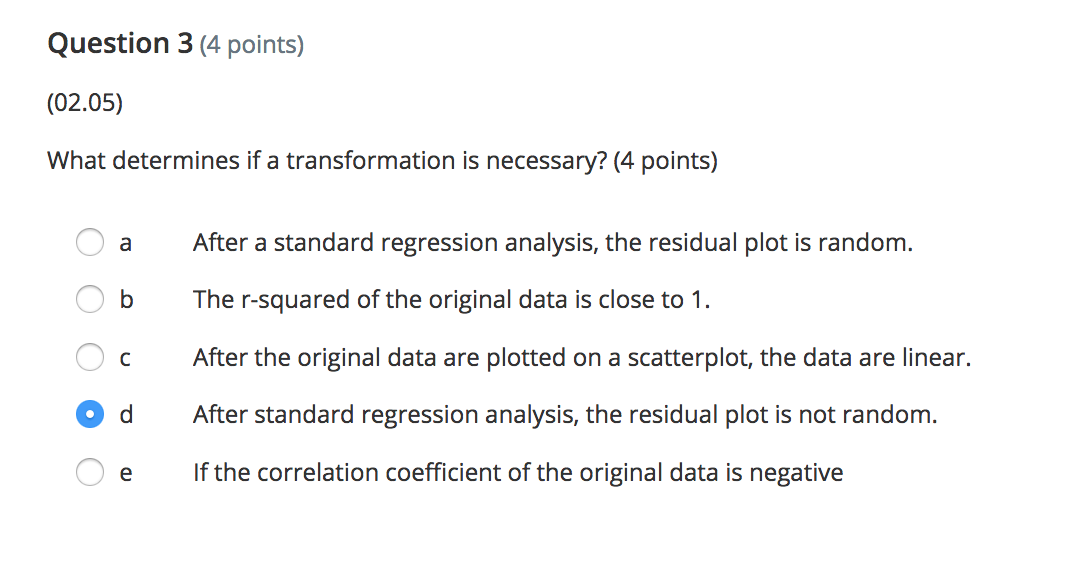
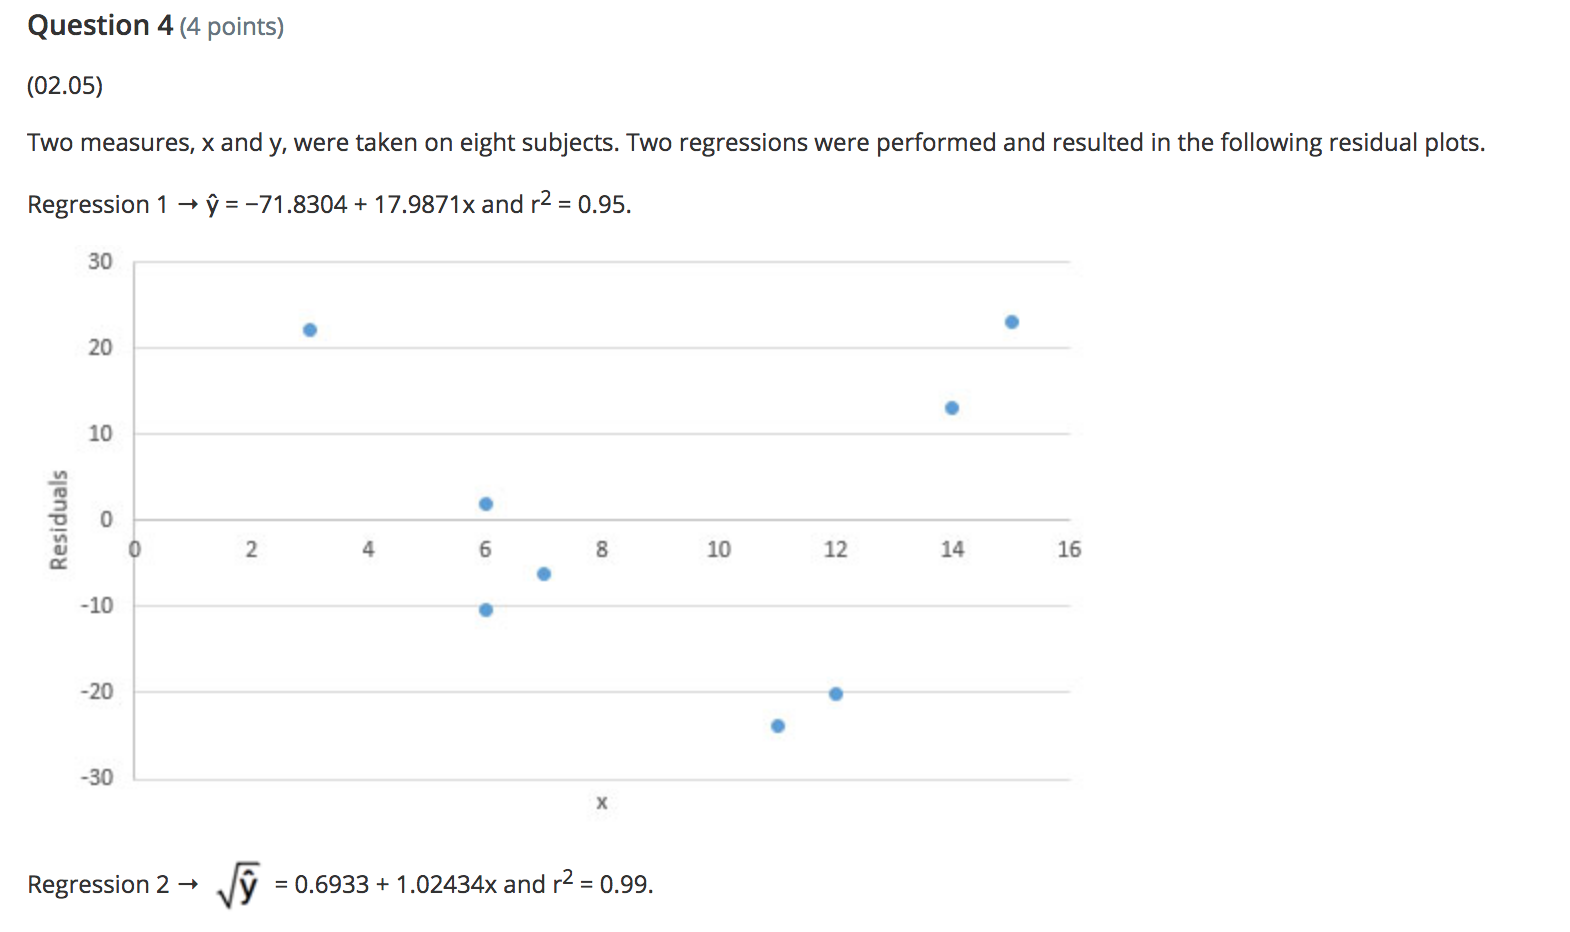
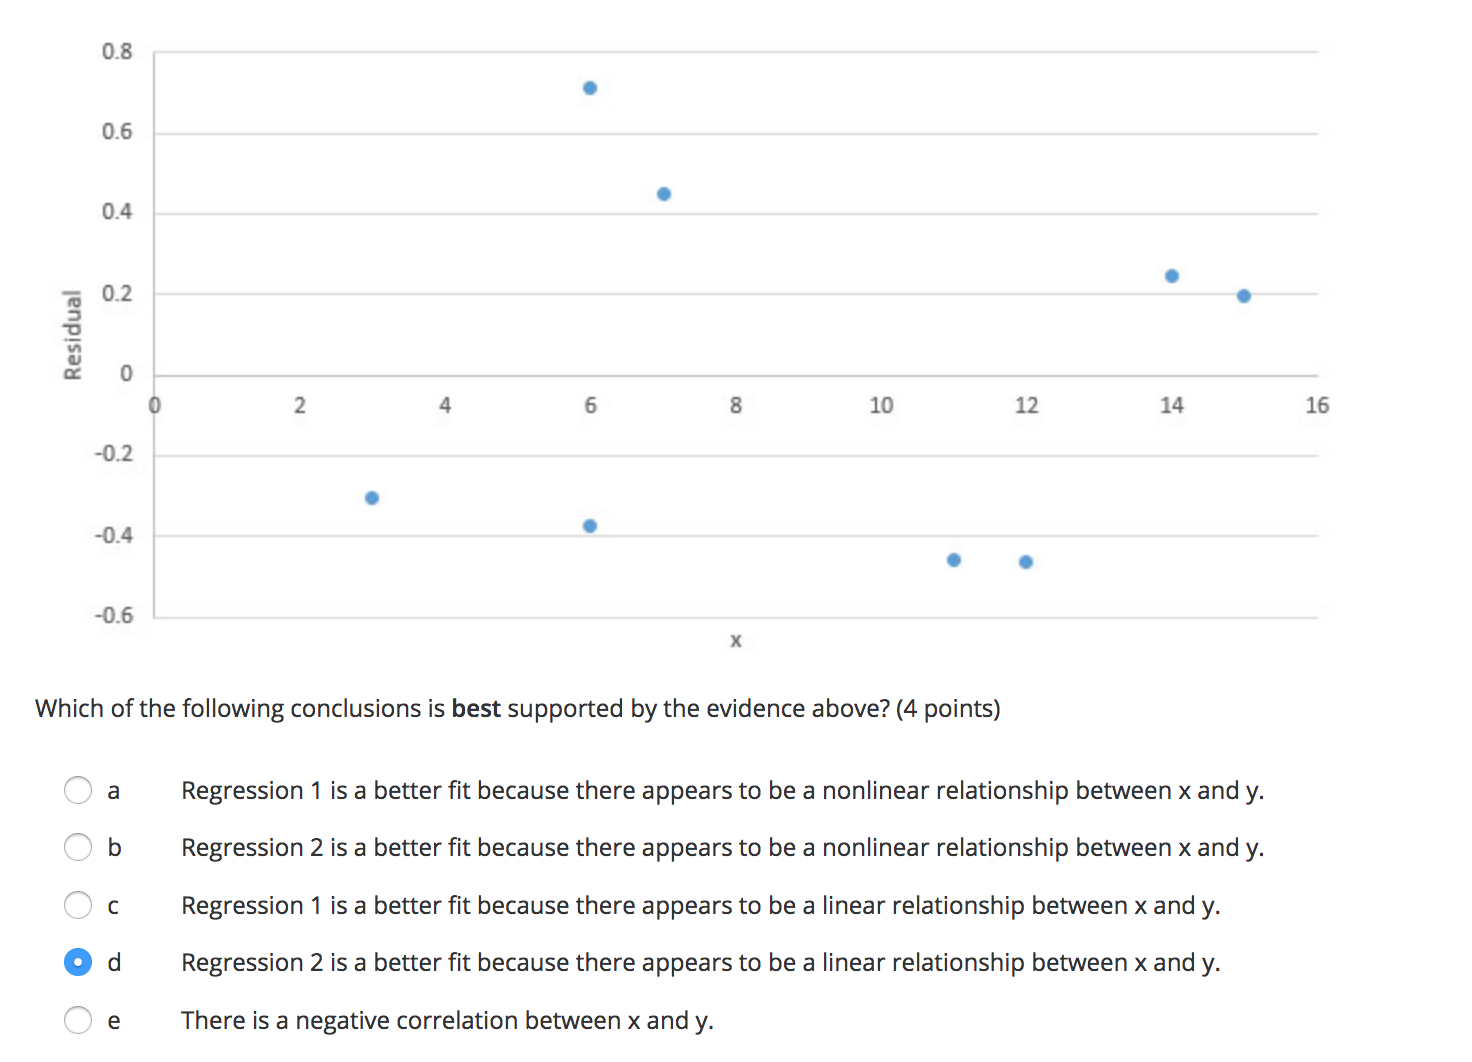
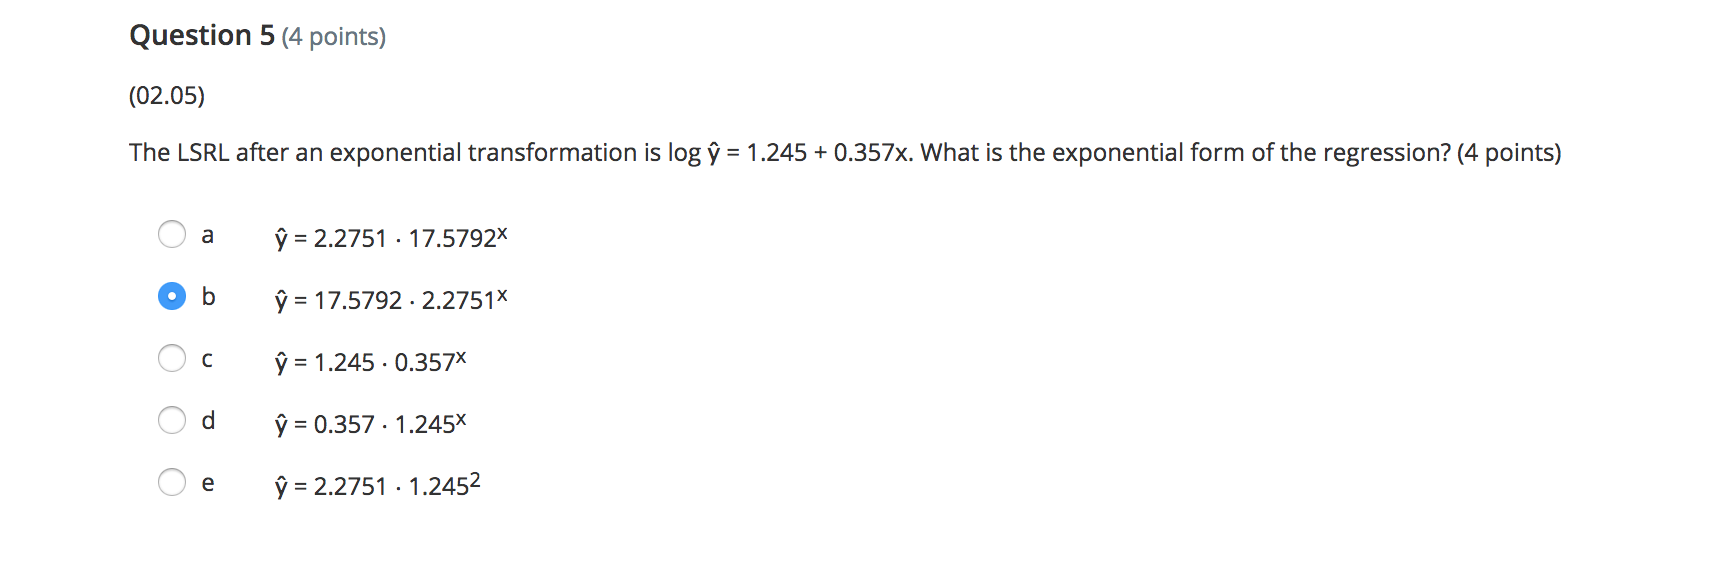
Question 1 (4 points) (02.05) The computer output from a set of data and a transformed set of data are below. Regression 1: Coefficients Standard Error t Stat P-value Intercept -249.8892857 138.0250971 -1.8104626690.129994962 Mass 30.25535714 3.828127423 7.903435231 0.000521765 R-sq. = 92.6% R-sq.(adj) = 91.1% Regression 2: Coefficients Standard Error t Stat P-value Intercept 0.068135113 0.082836516 0.822525095 0.448213112 VM ass 0.709742492 0.002297472 308.92329686.74531E-12 R-sq. = 99.9% R-sq.(adj) = 99.9% Which LSRL is a better fit? Explain. (4 points) O a Regression 1 is a better fit because r-squared is farther from 1 than r-squared in regression 2. Ob Regression 1 is a better fit because the intercept is negative. O c Regression 2 is a better fit because the intercept is closer to zero than the intercept in regression 1. O d Regression 2 is a better fit because r-squared is closer to 1 than r-squared in regression 1. O e Unable to determine which is a better fit.Question 2 (4 points) (02.05) Analyze the scatterplot to explain the most likely transformation necessary to linearize the data. (4 points) 2.5 2 y-values 1.5 1 0.5 2 3 5 6 x-values O a The scatterplot resembles a power model, emulating a square root function with a downward curve. Squaring the y-values would linearize the data. Ob The scatterplot resembles an exponential model, emulating a squared function with a downward curve. Squaring the y-values would linearize the data. O c The scatterplot resembles a power model, emulating a square root function with a downward curve. Taking the square root of the y-values would linearize the data. Od The scatterplot resembles a power model, emulating a squared function with a downward curve. Exponentialing the y-values to a power of 10 would linearize the data. O e The scatterplot resembles an exponential model, emulating a squared function with a downward curve. Exponentiatrg the y-values to a power of 10 would linearize the data.Question 3 (4 points) (02.05) What determines if a transformation is necessary? (4 points) 0 a After a standard regression analysis, the residual plot is random. 0 b The r-squared of the original data is close to 1. O c After the original data are plotted on a scatterplot, the data are linear. o d After standard regression analysis, the residual plot is not random. e If the correlation coefficient of the original data is negative Question 4(4 points) (02.05) Two measures, x and y, were taken on eight subjects. Two regressions were performed and resulted in the following residual plots. Regression 1 ' \\7 = -71.8304 + 17.9871 x and r2 = 0.95. so . O 20 - O 10 - 2 1'93 0 3 o 2 4 6 s 10 12 14 16 x o .'.. O 0 Regression 2 > J? = 0.5933 +1.02434x and r2 = 0.99. 0.8 o 0.6 o 0.4 o T. 0.2 . o 3 1' B n: 0 0 2 4 6 8 10 12 14 16 -0.2 o 41.4 ' 0 o -o.6 X Which of the following conclusions is best supported by the evidence above? (4 points) C a Regression 1 is a better fit because there appears to be a nonlinear relationship between x and y. 'C b Regression 2 is a better fit because there appears to be a nonlinear relationship between x and y. C c Regression 1 is a better fit because there appears to be a linear relationship between x and y. o d Regression 2 is a better fit because there appears to be a linear relationship between x and y. A ,-' e There is a negative correlation between x and y. Question 5 (4 points) (02.05) The LSRL after an exponential transformation is log? = 1.245 + 0357):. What is the exponential form of the regression? (4 points) a v = 2.2751 -17.5792>
Step by Step Solution
There are 3 Steps involved in it

Get step-by-step solutions from verified subject matter experts