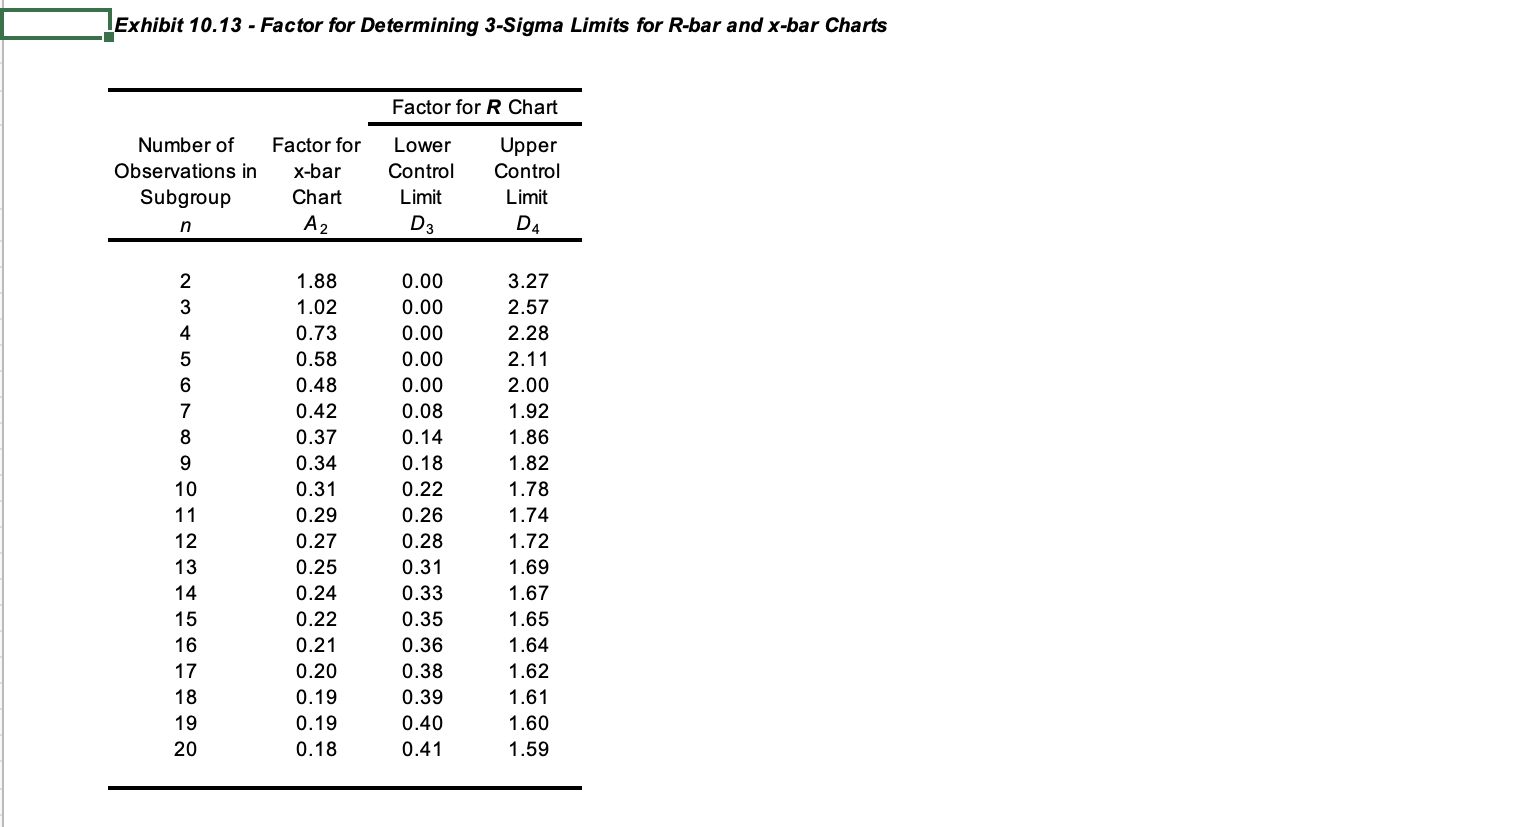
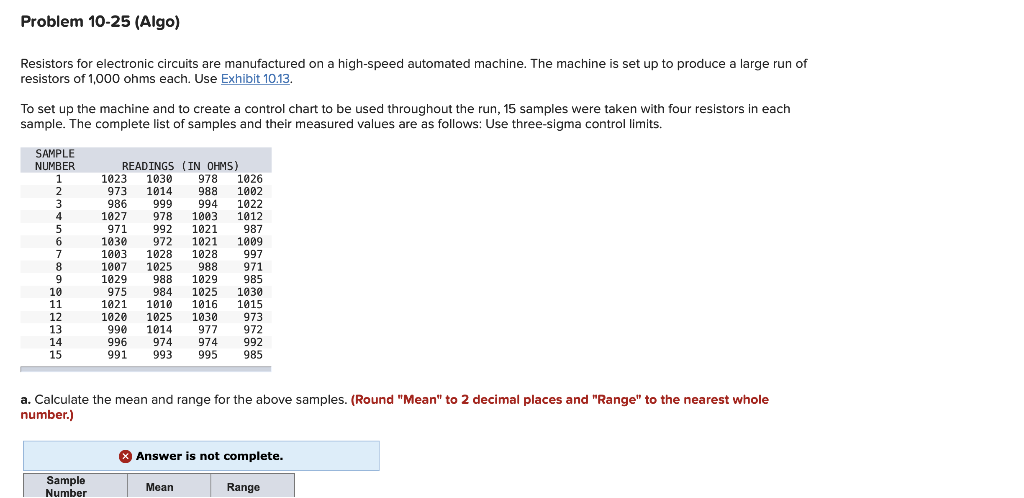
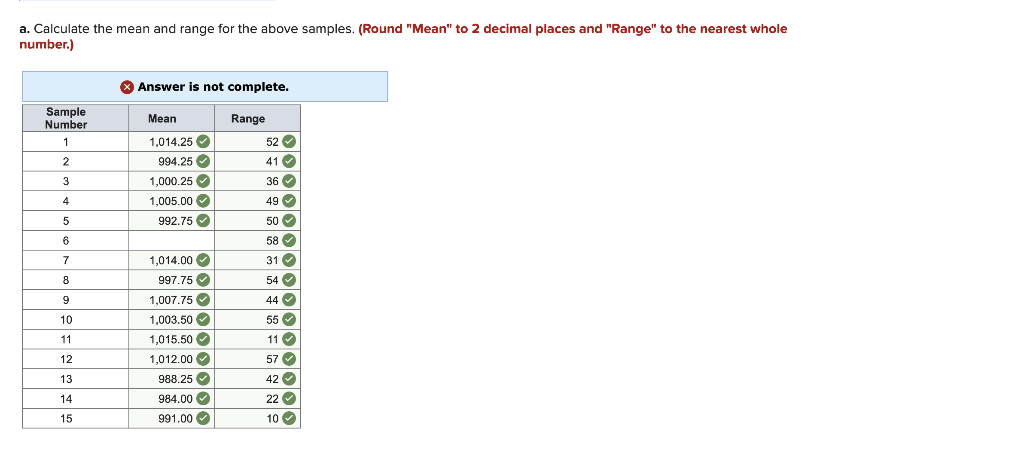
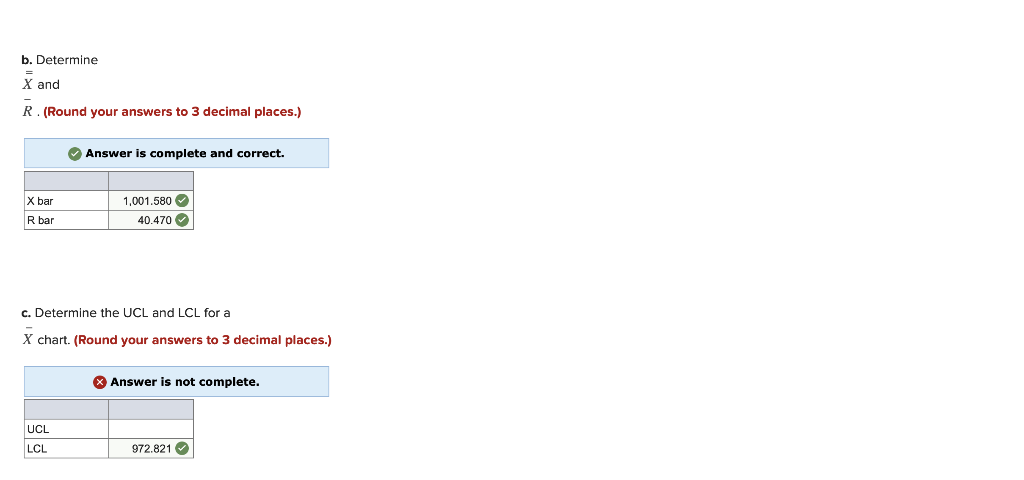
Question: Please this is the second time I post the same question, I needs the right answer Exhibit 10.13 - Factor for Determining 3-Sigma Limits for

Please this is the second time I post the same question, I needs the right answer

Please this is the second time I post the samePlease this is the second time I post the samePlease this is the second time I post the samePlease this is the second time I post the samePlease this is the second time I post the same

Exhibit 10.13 - Factor for Determining 3-Sigma Limits for R-bar and x-bar Charts Factor for R Chart Number of Observations in Subgroup n n Factor for x-bar Chart A2 Lower Control Limit D3 Upper Control Limit D4 OWN 2 3 4 5 6 7 8 9 10 11 12 13 14 15 16 17 18 19 20 1.88 1.02 0.73 0.58 0.48 0.42 0.37 0.34 0.31 0.29 0.27 0.25 0.24 0.22 0.21 0.20 0.19 0.19 0.18 0.00 0.00 0.00 0.00 0.00 0.08 0.14 0.18 0.22 0.26 0.28 0.31 0.33 0.35 0.36 0.38 0.39 0.40 0.41 3.27 2.57 2.28 2.11 2.00 1.92 1.86 1.82 1.78 1.74 1.72 1.69 1.67 1.65 1.64 1.62 1.61 1.60 1.59 Problem 10-25 (Algo) Resistors for electronic circuits are manufactured on a high-speed automated machine. The machine is set up to produce a large run of resistors of 1,000 ohms each. Use Exhibit 10.13. To set up the machine and to create a control chart to be used throughout the run, 15 samples were taken with four resistors in each sample. The complete list of samples and their measured values are as follows: Use three-sigma control limits. TUTTI SAMPLE NUMBER 1 2 3 4. 5 6 7 8 9 10 11 12 13 14 15 READINGS (IN OHMS) 1023 1030 978 1026 973 1014 988 1002 986 999 994 1022 1027 978 1003 1012 971 992 1021 987 1030 972 1021 1009 1993 1028 1028 997 1007 1025 988 971 1029 988 1029 985 975 984 1025 1030 1021 1010 1016 1015 1020 1025 1030 973 999 1014 977 972 996 974 974 992 991 993 995 985 wnumHe a. Calculate the mean and range for the above samples. (Round "Mean" to 2 decimal places and "Range" to the nearest whole number.) m Answer is not complete. Sample Number Mean Range a. Calculate the mean and range for the above samples. (Round "Mean" to 2 decimal places and "Range" to the nearest whole number.) * Answer is not complete. Mean Sample Number 1 2 1,014.25 994.25 1,000.25 Range 52 41 36 49 50 3 4 1,005.00 992.75 5 6 6 58 7 31 8 54 9 44 1,014.00 997.75 1,007.75 1,003.50 1,015.50 1,012.00 10 55 11 11 OOOOOOOOO 12 57 13 988.25 42 14 984.00 22 15 991.00 10 b. Determine = X and R. (Round your answers to 3 decimal places.) Answer is complete and correct. X bar R bar 1,001.580 40.470 c. Determine the UCL and LCL for a X chart. (Round your answers to 3 decimal places.) Answer is not complete. UCL LCL 972.821 X Answer is not complete. UCL LCL 972.821 d. Determine the UCL and LCL for R-chart. (Leave no cells blank - be certain to enter "0" wherever required. Round your answers to 3 decimal places.) X Answer is not complete. UCL LCL e. What comments can you make about the process? Process is in statistical control Process is out of statistical control

Step by Step Solution

There are 3 Steps involved in it

1 Expert Approved Answer
Step: 1 Unlock blur-text-image
Question Has Been Solved by an Expert!

Get step-by-step solutions from verified subject matter experts

Step: 2 Unlock
Step: 3 Unlock

Students Have Also Explored These Related General Management Questions!