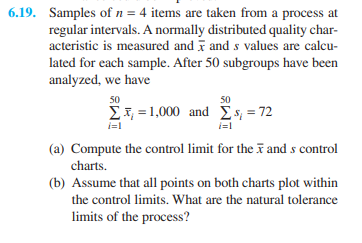
Question: Please to perform in excel and show formulas. Note: Please to perform in excel and show formulas. (Show pictures) 6.19. Samples of n = 4

Please to perform in excel and show formulas.

Note:

Please to perform in excel and show formulas. (Show pictures)

Please to perform in excel and show formulas.

Please to perform in excel and show formulas.

6.19. Samples of n = 4 items are taken from a process at regular intervals. A normally distributed quality char- acteristic is measured and 1 and s values are calcu- lated for each sample. After 50 subgroups have been analyzed, we have 50 = 1,000 and 5 = 72 50 i=1 (a) Compute the control limit for the 7 and s control charts. (b) Assume that all points on both charts plot within the control limits. What are the natural tolerance limits of the process? (c) If the specification limits are 19 4.0, what are your conclusions regarding the ability of the process to produce items conforming to specifi- cations? (d) Assuming that if an item exceeds the upper spec- ification limit it can be reworked, and if it is below the lower specification limit it must be scrapped, what percentage scrap and rework is the process now producing? (e) If the process were centered at u = 19.0, what would be the effect on percentage scrap and rework

Step by Step Solution

There are 3 Steps involved in it

1 Expert Approved Answer
Step: 1 Unlock blur-text-image
Question Has Been Solved by an Expert!

Get step-by-step solutions from verified subject matter experts

Step: 2 Unlock
Step: 3 Unlock

Students Have Also Explored These Related General Management Questions!