

Question: please try and answer questions 18 &19. all based off of MLHR's SEC financial records Pul er deal MCT FY Cash & Mek Day Prod
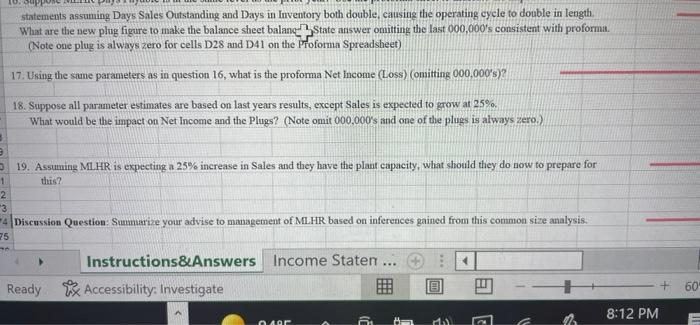
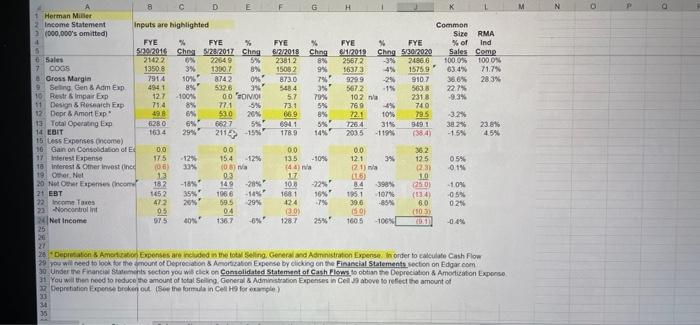
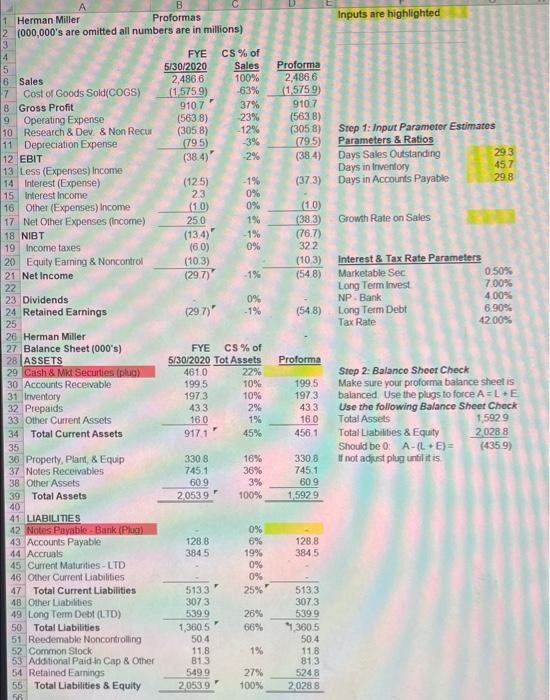
Pul er deal MCT FY Cash & Mek Day Prod N Payable Bank Cash&M Sec- Produa Net - Ca & Marble Sec Nates Perable B Produs Instructions&Answers Income Statement Balance Sheet Ratios Proforma Sheet5 Sheet6 ... Ready Accessibility: Investigate Type here to search O statements assuming Days Sales Outstanding and Days in Inventory both double, causing the operating cycle to double in length. What are the new plug figure to make the balance sheet balangState answer omitting the last 000,000's consistent with proforma. (Note one plug is always zero for cells D28 and D41 on the Proforma Spreadsheet) 17. Using the same parameters as in question 16, what is the proforma Net Income (Loss) (omitting 000,000's)? 18. Suppose all parameter estimates are based on last years results, except Sales is expected to grow at 25%. What would be the impact on Net Income and the Plugs? (Note omit 000,000's and one of the plugs is always zero.) 9 19. Assuming MLHR is expecting a 25% increase in Sales and they have the plant capacity, what should they do now to prepare for 1 this? 2 3 4 Discussion Question: Summarize your advise to management of MLHR based on inferences gained from this common size analysis. 75 me Instructions&Answers Income Staten... + 4 Ready Accessibility: Investigate 0.495 a 8 Mil 6 12 8:12 PM 60 11: 8 C E F H Herman Miller Income Statement (000,000's omitted) Inputs are highlighted 4 % FYE % FYE 5 FYE 5/30/2016 21422 Sang SX:2017 6% Sales 2264.9 Chng 5% 1390.7 8% 6/2/2018 23812 15082 7 COGS 1350.8 3% FYE % FYE 6/1/2019 Ching 5/30/2020 2567.2 -3% 2486.6 1637.3 4% 1575.9 929.9 -2% 910.7 567.2 -1% 10.2 n/a 8 Gross Margin 7914 10% 874.2 0% 873.0 9 Selling Gen & Adm Exp 494 1 8% 5484 10 Restr & Impair Exp 12.7 -100% 5326 00 774 3% OVO 563.8 22.7% 231.8 -9.3% 5.7 11 Design & Research Exp 71.4 -5% 73.1 769 4% 74.0 12 Depr & Amort Exp 49.8 53.0 20% 66.9 72.1 10% 79.5 -3.2% 13 Total Operating Exp 6280 6627 5% 694 1 726.4 31% 949 1 38.2% 14 EBIT 1634 211 -15% 178.9 14% 203.5 (38.4) -1.5% 15 Less Expenses Oncome) 10 Gain on Consolidation of Ed 00 00 0.0 0.0 17 Interest Expense 17.5 15.4 -12% 36.2 12.5 13.5 -10% 12.1 3% 0.5% 18 Interest & Other invest (inc (06) (08) na (44) a (21) n/a -0.1% 19 Other Net 13 (23) 10 0.3 (1.6) 20 Not Other Expenses (incom 18.2 -18% 149 -20% 17 10 B 8.4 398% (250) -1.0% -22% 16% 21 EBT 145.2 35% 195.1 107% 196.6 -14%* 1681 59.5 -29% (13.4) -0.5% 22 Income Taxes 424 -7% 47.2 20% 05 6.0 0.2% 23 -Noncontrol int 04 39.6 -85% (50) -100% (103) 24 Net Income 97.5 40% 136.7 -0%" 128.7 160.5 10:11 -0.4% 25 26 27 28 Depretation & Amortization Expenses are included in the total Selling General and Administration Expense. In order to calculate Cash Flow 29 you will need to look for the amount of Depreciation & Amortization Expense by clicking on the Financial Statements section on Edgar.com 30 Under the Financial Statements section you will click on Consolidated Statement of Cash Flows to obtian the Depreciation & Amortization Expense 31 You will then need to reduce the amount of total Selling, General & Administration Expenses in Cell 29 above to reflect the amount of 32 Depretiation Expense broken out (See the formula in Cell H9 for example) 33 8% 6% 6% 29% -12% 33% D (3.0) % Ching 8% 9% 7% 3% 79% 5% 8% 5%' Common Size RMA % of Ind Sales Comp 100.0% 100.0% 63.4% 71.7% 36.6% 28.3% 23.8% 4.5% N 0 a A B Proformas 1 Herman Miller 2 (000,000's are omitted all numbers are in millions) 3 4 FYE CS% of 5 5/30/2020 Sales 6 Sales 2,486 6 100% 7 Cost of Goods Sold(COGS) (1,575.9) -63% 8 Gross Profit 9107 37% 9 Operating Expense (563.8) -23% 10 Research & Dev & Non Recur (305.8) -12% (79.5) -3% 11 Depreciation Expense 12 EBIT (38.4) 13 Less (Expenses) Income 14 Interest (Expense) (125) 15 Interest Income 2.3 16 Other (Expenses) Income (1.0) 17 Net Other Expenses (income) 25.0 18 NIBT (13.4) 19 Income taxes (6.0) 20 Equity Earning & Noncontrol (10.3) 21 Net Income (29.7) 22 23 Dividends 24 Retained Earnings 25 (297) -1% 26 Herman Miller. 27 Balance Sheet (000's) FYE CS % of 28 ASSETS 5/30/2020 Tot Assets 29 Cash & Mkt Securties (plug) 461.0 22% 30 Accounts Receivable 199.5 10% 31 Inventory 197.3 10% 32 Prepaids 43.3 33 Other Current Assets 16.0 34 Total Current Assets 917.1 35 36 Property, Plant, & Equip 330.8 37 Notes Receivables 745.1 38 Other Assets 60.9 39 Total Assets 2,0539 40 41 LIABILITIES 42 Notes Payable-Bank (Plug) 43 Accounts Payable 128.8 44 Accruals 384.5 45 Current Maturities-LTD 46 Other Current Liabilities 47 Total Current Liabilities 513.3 48 Other Liabilities 307 3 49 Long Term Debt (LTD) 539.9 50 Total Liabilities 1,360 5 51 Reedemable Noncontrolling 50.4 52 Common Stock 11.8 53 Additional Paid-in Cap & Other 81.3 54 Retained Earnings 549.9 55 Total Liabilities & Equity 2,053.9 56 ** *66446 * ** 0% -1% 2% 1% 45% 16% 36% 3% 100% 0% 6% 19% 0% 0% 25% 26% 66% 1% 27% 100% Proforma 2,486,6 (1,5759) 910.7 (563.8) (305.8) (79.5) (38.4) (37.3) (1.0) (38.3) (76.7) 32.2 (10.3) (54.8) (54.8) Proforma 199.5 197.3 43.3 16.0 456.1 330.8 745.1 60.9 1,592.9 128.8 384 5 513.3 307.3 539.9 1,360.5 50.4 11.8 81.3 5248 2,028 8 Inputs are highlighted Step 1: Input Parameter Estimates Parameters & Ratios Days Sales Outstanding Days in Inventory Days in Accounts Payable Growth Rate on Sales Interest & Tax Rate Parameters Marketable Sec 0.50% Long Term Invest 7.00% NP Bank 4.00% 6.90% Long Term Debt Tax Rate 42.00% Step 2: Balance Sheet Check Make sure your proforma balance sheet is balanced. Use the plugs to force A=L+E Use the following Balance Sheet Check Total Assets 1,5929 Total Liabilities & Equity 2,028 8 Should be 0: A-(L+E)= If not adjust plug until it is 29.3 45.7 29.8 (435.9) Pul er deal MCT FY Cash & Mek Day Prod N Payable Bank Cash&M Sec- Produa Net - Ca & Marble Sec Nates Perable B Produs Instructions&Answers Income Statement Balance Sheet Ratios Proforma Sheet5 Sheet6 ... Ready Accessibility: Investigate Type here to search O statements assuming Days Sales Outstanding and Days in Inventory both double, causing the operating cycle to double in length. What are the new plug figure to make the balance sheet balangState answer omitting the last 000,000's consistent with proforma. (Note one plug is always zero for cells D28 and D41 on the Proforma Spreadsheet) 17. Using the same parameters as in question 16, what is the proforma Net Income (Loss) (omitting 000,000's)? 18. Suppose all parameter estimates are based on last years results, except Sales is expected to grow at 25%. What would be the impact on Net Income and the Plugs? (Note omit 000,000's and one of the plugs is always zero.) 9 19. Assuming MLHR is expecting a 25% increase in Sales and they have the plant capacity, what should they do now to prepare for 1 this? 2 3 4 Discussion Question: Summarize your advise to management of MLHR based on inferences gained from this common size analysis. 75 me Instructions&Answers Income Staten... + 4 Ready Accessibility: Investigate 0.495 a 8 Mil 6 12 8:12 PM 60 11: 8 C E F H Herman Miller Income Statement (000,000's omitted) Inputs are highlighted 4 % FYE % FYE 5 FYE 5/30/2016 21422 Sang SX:2017 6% Sales 2264.9 Chng 5% 1390.7 8% 6/2/2018 23812 15082 7 COGS 1350.8 3% FYE % FYE 6/1/2019 Ching 5/30/2020 2567.2 -3% 2486.6 1637.3 4% 1575.9 929.9 -2% 910.7 567.2 -1% 10.2 n/a 8 Gross Margin 7914 10% 874.2 0% 873.0 9 Selling Gen & Adm Exp 494 1 8% 5484 10 Restr & Impair Exp 12.7 -100% 5326 00 774 3% OVO 563.8 22.7% 231.8 -9.3% 5.7 11 Design & Research Exp 71.4 -5% 73.1 769 4% 74.0 12 Depr & Amort Exp 49.8 53.0 20% 66.9 72.1 10% 79.5 -3.2% 13 Total Operating Exp 6280 6627 5% 694 1 726.4 31% 949 1 38.2% 14 EBIT 1634 211 -15% 178.9 14% 203.5 (38.4) -1.5% 15 Less Expenses Oncome) 10 Gain on Consolidation of Ed 00 00 0.0 0.0 17 Interest Expense 17.5 15.4 -12% 36.2 12.5 13.5 -10% 12.1 3% 0.5% 18 Interest & Other invest (inc (06) (08) na (44) a (21) n/a -0.1% 19 Other Net 13 (23) 10 0.3 (1.6) 20 Not Other Expenses (incom 18.2 -18% 149 -20% 17 10 B 8.4 398% (250) -1.0% -22% 16% 21 EBT 145.2 35% 195.1 107% 196.6 -14%* 1681 59.5 -29% (13.4) -0.5% 22 Income Taxes 424 -7% 47.2 20% 05 6.0 0.2% 23 -Noncontrol int 04 39.6 -85% (50) -100% (103) 24 Net Income 97.5 40% 136.7 -0%" 128.7 160.5 10:11 -0.4% 25 26 27 28 Depretation & Amortization Expenses are included in the total Selling General and Administration Expense. In order to calculate Cash Flow 29 you will need to look for the amount of Depreciation & Amortization Expense by clicking on the Financial Statements section on Edgar.com 30 Under the Financial Statements section you will click on Consolidated Statement of Cash Flows to obtian the Depreciation & Amortization Expense 31 You will then need to reduce the amount of total Selling, General & Administration Expenses in Cell 29 above to reflect the amount of 32 Depretiation Expense broken out (See the formula in Cell H9 for example) 33 8% 6% 6% 29% -12% 33% D (3.0) % Ching 8% 9% 7% 3% 79% 5% 8% 5%' Common Size RMA % of Ind Sales Comp 100.0% 100.0% 63.4% 71.7% 36.6% 28.3% 23.8% 4.5% N 0 a A B Proformas 1 Herman Miller 2 (000,000's are omitted all numbers are in millions) 3 4 FYE CS% of 5 5/30/2020 Sales 6 Sales 2,486 6 100% 7 Cost of Goods Sold(COGS) (1,575.9) -63% 8 Gross Profit 9107 37% 9 Operating Expense (563.8) -23% 10 Research & Dev & Non Recur (305.8) -12% (79.5) -3% 11 Depreciation Expense 12 EBIT (38.4) 13 Less (Expenses) Income 14 Interest (Expense) (125) 15 Interest Income 2.3 16 Other (Expenses) Income (1.0) 17 Net Other Expenses (income) 25.0 18 NIBT (13.4) 19 Income taxes (6.0) 20 Equity Earning & Noncontrol (10.3) 21 Net Income (29.7) 22 23 Dividends 24 Retained Earnings 25 (297) -1% 26 Herman Miller. 27 Balance Sheet (000's) FYE CS % of 28 ASSETS 5/30/2020 Tot Assets 29 Cash & Mkt Securties (plug) 461.0 22% 30 Accounts Receivable 199.5 10% 31 Inventory 197.3 10% 32 Prepaids 43.3 33 Other Current Assets 16.0 34 Total Current Assets 917.1 35 36 Property, Plant, & Equip 330.8 37 Notes Receivables 745.1 38 Other Assets 60.9 39 Total Assets 2,0539 40 41 LIABILITIES 42 Notes Payable-Bank (Plug) 43 Accounts Payable 128.8 44 Accruals 384.5 45 Current Maturities-LTD 46 Other Current Liabilities 47 Total Current Liabilities 513.3 48 Other Liabilities 307 3 49 Long Term Debt (LTD) 539.9 50 Total Liabilities 1,360 5 51 Reedemable Noncontrolling 50.4 52 Common Stock 11.8 53 Additional Paid-in Cap & Other 81.3 54 Retained Earnings 549.9 55 Total Liabilities & Equity 2,053.9 56 ** *66446 * ** 0% -1% 2% 1% 45% 16% 36% 3% 100% 0% 6% 19% 0% 0% 25% 26% 66% 1% 27% 100% Proforma 2,486,6 (1,5759) 910.7 (563.8) (305.8) (79.5) (38.4) (37.3) (1.0) (38.3) (76.7) 32.2 (10.3) (54.8) (54.8) Proforma 199.5 197.3 43.3 16.0 456.1 330.8 745.1 60.9 1,592.9 128.8 384 5 513.3 307.3 539.9 1,360.5 50.4 11.8 81.3 5248 2,028 8 Inputs are highlighted Step 1: Input Parameter Estimates Parameters & Ratios Days Sales Outstanding Days in Inventory Days in Accounts Payable Growth Rate on Sales Interest & Tax Rate Parameters Marketable Sec 0.50% Long Term Invest 7.00% NP Bank 4.00% 6.90% Long Term Debt Tax Rate 42.00% Step 2: Balance Sheet Check Make sure your proforma balance sheet is balanced. Use the plugs to force A=L+E Use the following Balance Sheet Check Total Assets 1,5929 Total Liabilities & Equity 2,028 8 Should be 0: A-(L+E)= If not adjust plug until it is 29.3 45.7 29.8 (435.9)
Step by Step Solution
There are 3 Steps involved in it

Get step-by-step solutions from verified subject matter experts