

Question: please try to do all parts! if you cannot, I need help for subsets part E , F , & G thank u:) Consider the
please try to do all parts! if you cannot, I need help for subsets part E , F , & G
thank u:)
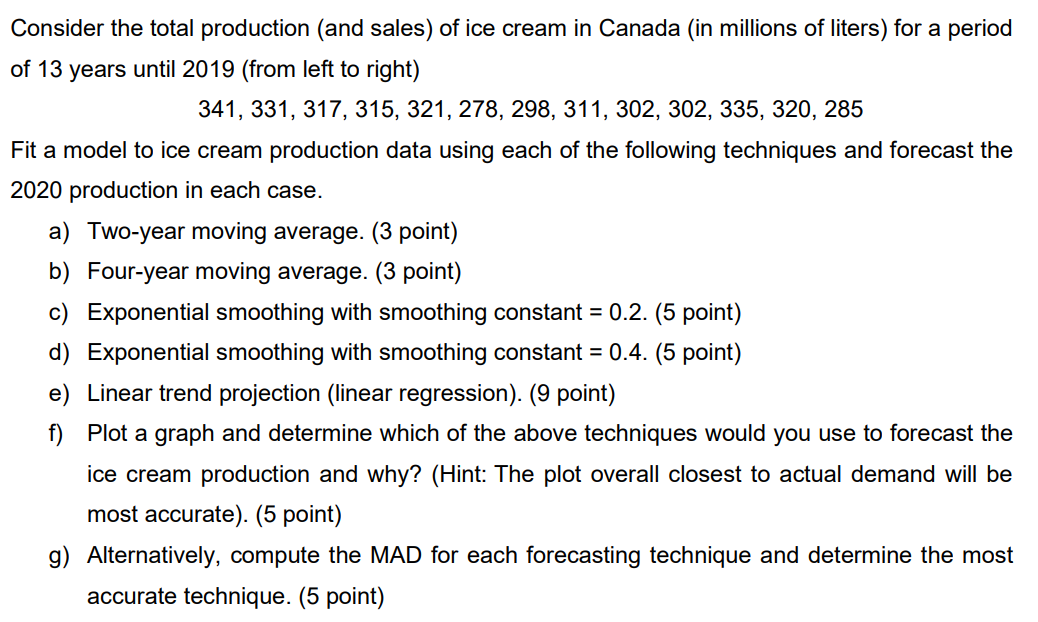
Consider the total production (and sales) of ice cream in Canada (in millions of liters) for a period of 13 years until 2019 (from left to right) 341, 331, 317, 315, 321, 278, 298, 311, 302, 302, 335, 320, 285 Fit a model to ice cream production data using each of the following techniques and forecast the 2020 production in each case. a) Two-year moving average. (3 point) b) Four-year moving average. (3 point) c) Exponential smoothing with smoothing constant = 0.2. (5 point) d) Exponential smoothing with smoothing constant = 0.4. (5 point) e) Linear trend projection (linear regression). (9 point) f) Plot a graph and determine which of the above techniques would you use to forecast the ice cream production and why? (Hint: The plot overall closest to actual demand will be most accurate). (5 point) g) Alternatively, compute the MAD for each forecasting technique and determine the most accurate technique. (5 point)Step by Step Solution
There are 3 Steps involved in it
1 Expert Approved Answer
Step: 1 Unlock

Question Has Been Solved by an Expert!
Get step-by-step solutions from verified subject matter experts
Step: 2 Unlock
Step: 3 Unlock