

Question: please, try to explain how can do excel? Objectives and general instruction: The objective of this assignment is to engage you in a real life
please, try to explain how can do excel?
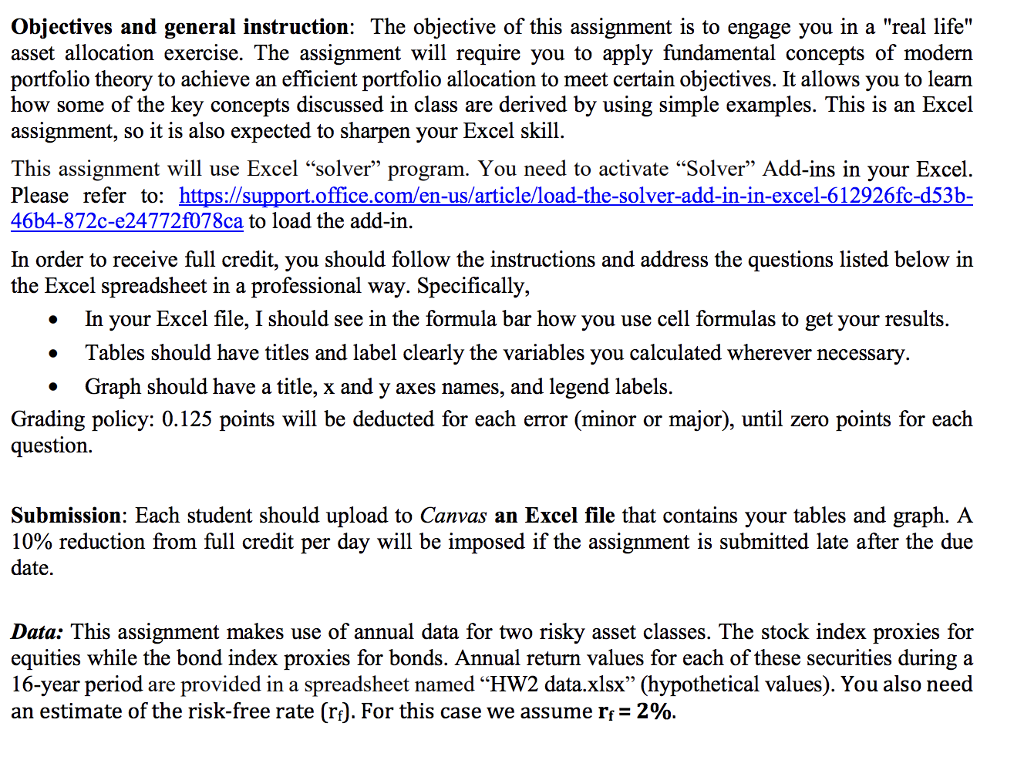
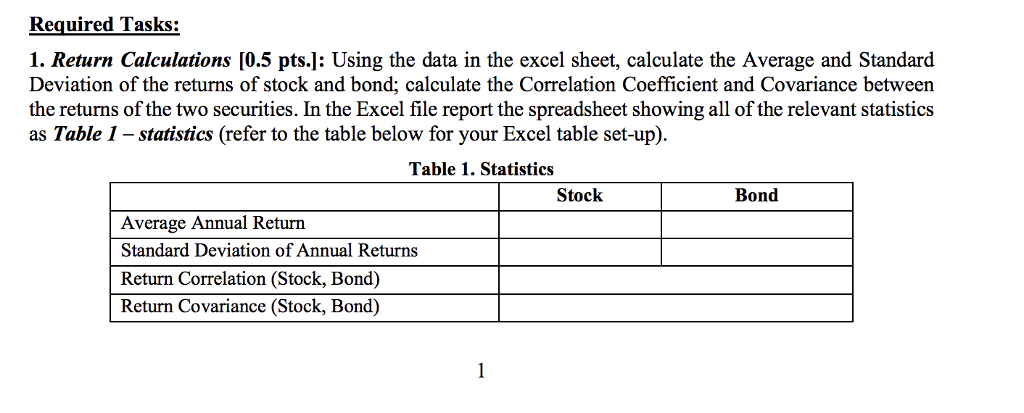
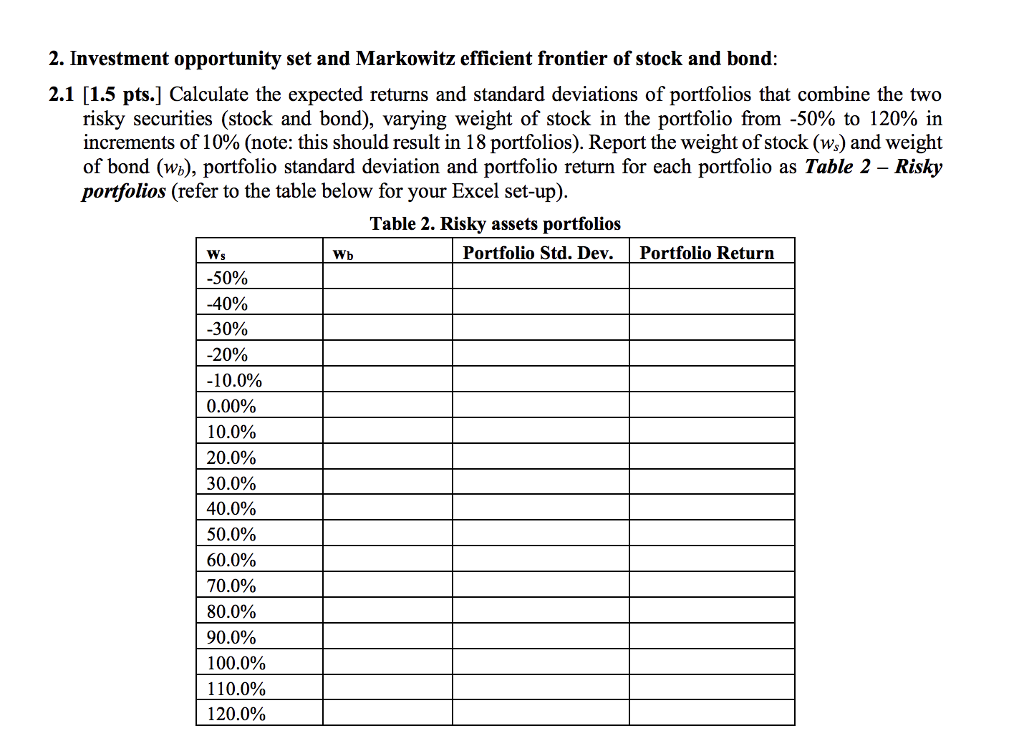
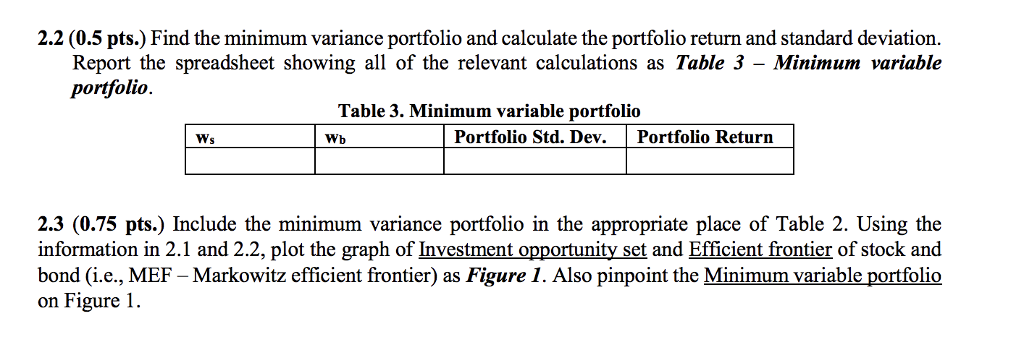
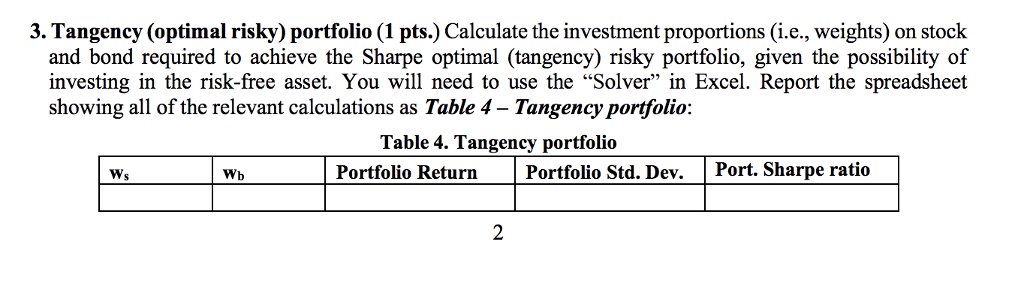
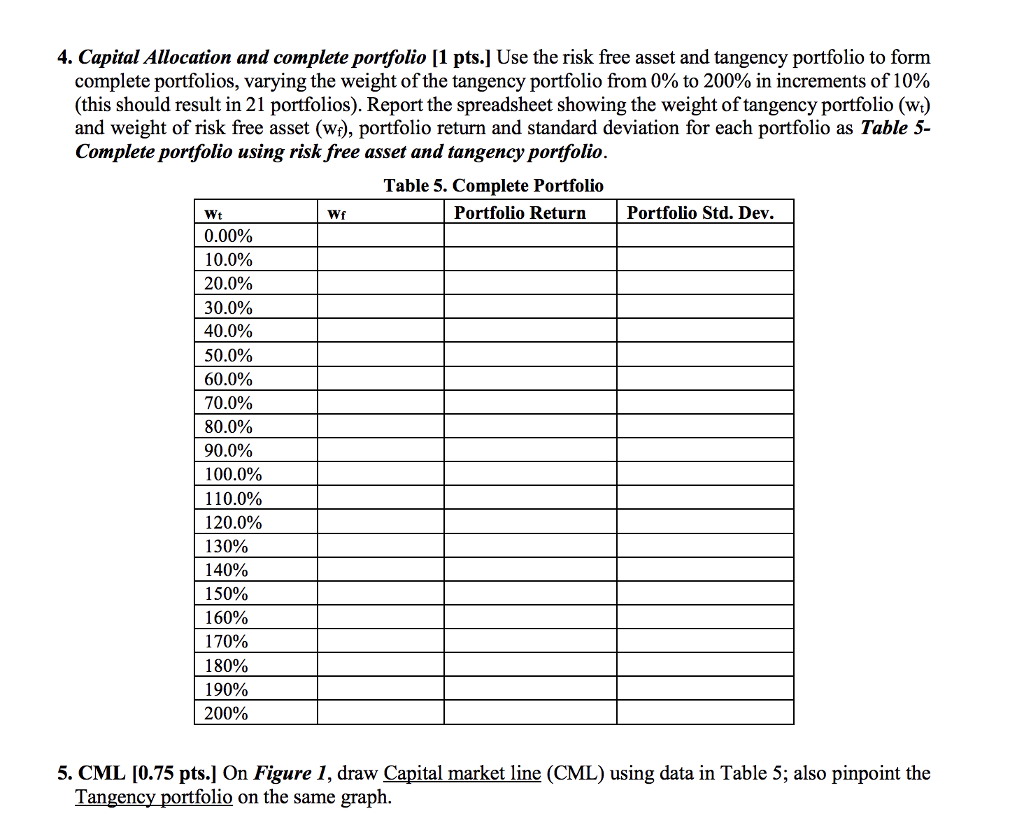
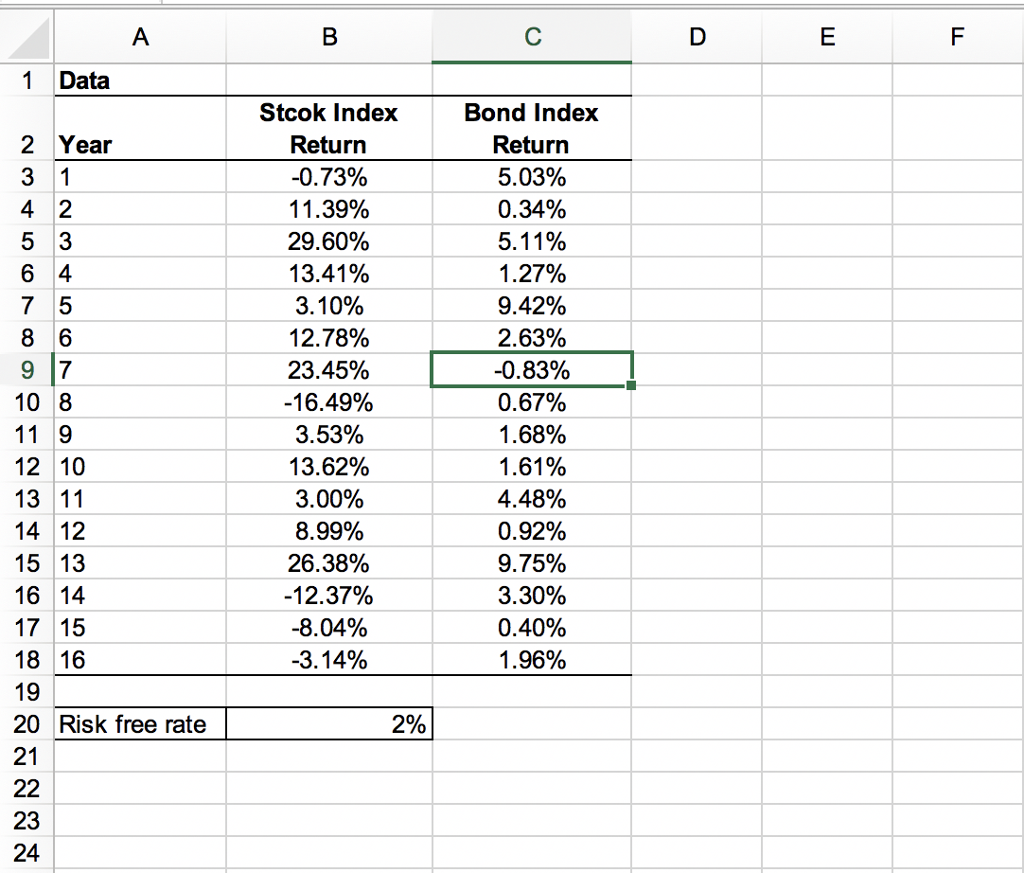
Objectives and general instruction: The objective of this assignment is to engage you in a "real life" asset allocation exercise. The assignment will require you to apply fundamental concepts of modern portfolio theory to achieve an efficient portfolio allocation to meet certain objectives. It allows you to learn how some of the key concepts discussed in class are derived by using simple examples. This is an Excel assignment, so it is also expected to sharpen your Excel skill This assignment will use Excel "solver" program. You need to activate "Solver" Add-ins in your Excel. Please refer to: https://support.office.com/en-us/article/load-the-solver-add-in-in-excel-612926fc-d53b- 46b4-872c-e24772f078ca to load the add-in In order to receive full credit, you should follow the instructions and address the questions listed below in the Excel spreadsheet in a professional way. Specifically . In your Excel file, I should see in the formula bar how you use cell formulas to get your results . Tables should have titles and label clearly the variables you calculated wherever necessary * Graph should have a title, x and y axes names, and legend labels. Grading policy: 0.125 points will be deducted for each error (minor or major), until zero points for each question. Submission: Each student should upload to Canvas an Excel file that contains your tables and graph. A 10% reduction from full credit per day will be imposed if the assignment is submitted late after the due date Data: This assignment makes use of annual data for two risky asset classes. The stock index proxies for equities while the bond index proxies for bonds. Annual return values for each of these securities during a 16-year period are provided in a spreadsheet named "HW2 data.xlsx" (hypothetical values). You also need an estimate of the risk-free rate(r). For this case we assume rf-290. Objectives and general instruction: The objective of this assignment is to engage you in a "real life" asset allocation exercise. The assignment will require you to apply fundamental concepts of modern portfolio theory to achieve an efficient portfolio allocation to meet certain objectives. It allows you to learn how some of the key concepts discussed in class are derived by using simple examples. This is an Excel assignment, so it is also expected to sharpen your Excel skill This assignment will use Excel "solver" program. You need to activate "Solver" Add-ins in your Excel. Please refer to: https://support.office.com/en-us/article/load-the-solver-add-in-in-excel-612926fc-d53b- 46b4-872c-e24772f078ca to load the add-in In order to receive full credit, you should follow the instructions and address the questions listed below in the Excel spreadsheet in a professional way. Specifically . In your Excel file, I should see in the formula bar how you use cell formulas to get your results . Tables should have titles and label clearly the variables you calculated wherever necessary * Graph should have a title, x and y axes names, and legend labels. Grading policy: 0.125 points will be deducted for each error (minor or major), until zero points for each question. Submission: Each student should upload to Canvas an Excel file that contains your tables and graph. A 10% reduction from full credit per day will be imposed if the assignment is submitted late after the due date Data: This assignment makes use of annual data for two risky asset classes. The stock index proxies for equities while the bond index proxies for bonds. Annual return values for each of these securities during a 16-year period are provided in a spreadsheet named "HW2 data.xlsx" (hypothetical values). You also need an estimate of the risk-free rate(r). For this case we assume rf-290
Step by Step Solution
There are 3 Steps involved in it

Get step-by-step solutions from verified subject matter experts