

Question: Please turn in your version of the graph or graphs or figures using the Example Hemolysis Data (pictured above) as your source of data averages.
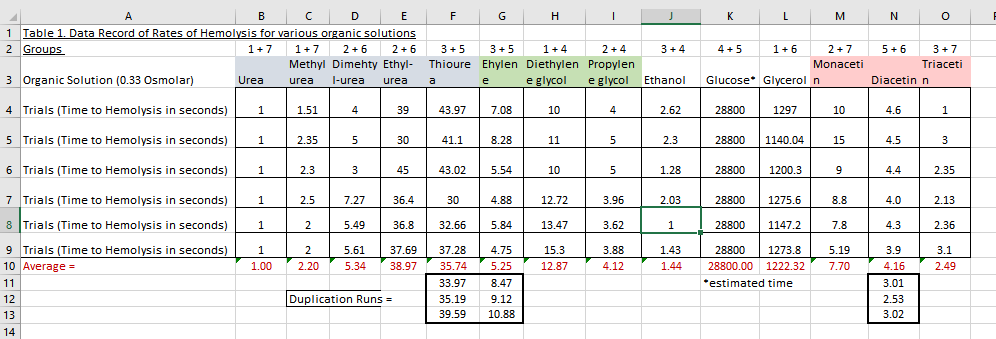
"Please turn in your version of the graph or graphs or figures using the Example Hemolysis Data (pictured above) as your source of data averages. For full credit, apply SEM or standard deviation bars bracketing the icons of the average data points in your figure."
Instructions from my professor above. Please graph this data as you see fit and include error bars (THIS IS A MUST HAVE).
Please explain what you graphed. Additionally, instructions on how to apply the standard deviation bars using this data would be appreciated as well.
Thanks!
F H I J K L M N O B C D E 1 Table 1. Data Record of Rates of Hemolysis for various organic solutions 2 Groups 1+7 1 +7 2 + 6 2 + 6 Methyl Dimehty Ethyl- 3 Organic Solution (0.33 Osmolar) Urea urea l-urea urea 3 +5 3 +5 1+4 2 + 4 3+4 Thioure Ehylen Diethylen Propylen e e glycol e glycol Ethanol 4+5 1 + 6 2+7 Monaceti Glucose* Glycerol n 5+6 3 +7 Triaceti Diacetin n 4 Trials (Time to Hemolysis in seconds) 1 1.51 4 39 43.97 7.08 10 4 2.62 28800 1297 10 4.6 1 5 Trials (Time to Hemolysis in seconds) 1 1 2.35 5 30 41.1 8.28 11 5 2.3 28800 1140.04 15 4.5 3 6 Trials (Time to Hemolysis in seconds) 1 2.3 3 45 43.02 5.54 10 5 1.28 28800 1200.3 9 4.4 2.35 1 2.5 7.27 36.4 30 4.88 12.72 3.96 2.03 28800 1275.6 8.8 4.0 2.13 7 Trials (Time to Hemolysis in seconds) 8 Trials (Time to Hemolysis in seconds) 1 2 5.49 36.8 32.66 5.84 13.47 3.62 1 28800 1147.2 7.8 4.3 2.36 1 1.00 2 2.20 5.61 5.34 37.69 38.97 4.75 5.25 8.47 15.3 12.87 3.88 4.12 1.43 1.44 28800 1273.8 28800.00 1222.32 *estimated time 5.19 7.70 37.28 35.74 33.97 35.19 39.59 3.1 2.49 9 Trials (Time to Hemolysis in seconds) 10 Average = 11 12 13 14 3.9 4.16 3.01 2.53 3.02 Duplication Runs = 9.12 10.88 F H I J K L M N O B C D E 1 Table 1. Data Record of Rates of Hemolysis for various organic solutions 2 Groups 1+7 1 +7 2 + 6 2 + 6 Methyl Dimehty Ethyl- 3 Organic Solution (0.33 Osmolar) Urea urea l-urea urea 3 +5 3 +5 1+4 2 + 4 3+4 Thioure Ehylen Diethylen Propylen e e glycol e glycol Ethanol 4+5 1 + 6 2+7 Monaceti Glucose* Glycerol n 5+6 3 +7 Triaceti Diacetin n 4 Trials (Time to Hemolysis in seconds) 1 1.51 4 39 43.97 7.08 10 4 2.62 28800 1297 10 4.6 1 5 Trials (Time to Hemolysis in seconds) 1 1 2.35 5 30 41.1 8.28 11 5 2.3 28800 1140.04 15 4.5 3 6 Trials (Time to Hemolysis in seconds) 1 2.3 3 45 43.02 5.54 10 5 1.28 28800 1200.3 9 4.4 2.35 1 2.5 7.27 36.4 30 4.88 12.72 3.96 2.03 28800 1275.6 8.8 4.0 2.13 7 Trials (Time to Hemolysis in seconds) 8 Trials (Time to Hemolysis in seconds) 1 2 5.49 36.8 32.66 5.84 13.47 3.62 1 28800 1147.2 7.8 4.3 2.36 1 1.00 2 2.20 5.61 5.34 37.69 38.97 4.75 5.25 8.47 15.3 12.87 3.88 4.12 1.43 1.44 28800 1273.8 28800.00 1222.32 *estimated time 5.19 7.70 37.28 35.74 33.97 35.19 39.59 3.1 2.49 9 Trials (Time to Hemolysis in seconds) 10 Average = 11 12 13 14 3.9 4.16 3.01 2.53 3.02 Duplication Runs = 9.12 10.88
Step by Step Solution
There are 3 Steps involved in it

Get step-by-step solutions from verified subject matter experts