

Question: please ty.pe or wr.ite ans.wers clearly 2-8 Graphical Analysis 55. (II) Figure 2-42 shows the velocity of a train as a function of time. (a)
please ty.pe or wr.ite ans.wers clearly
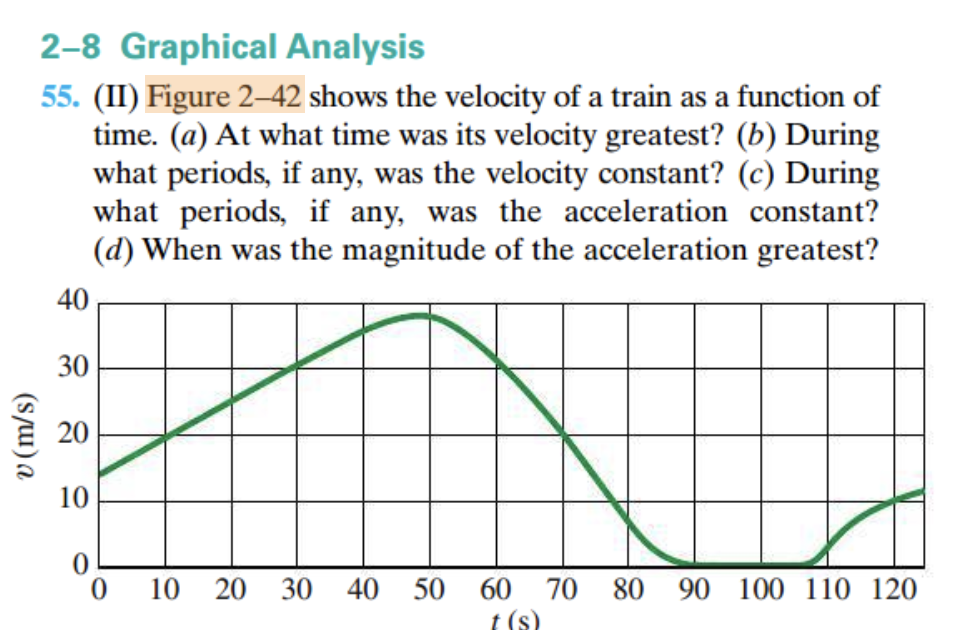
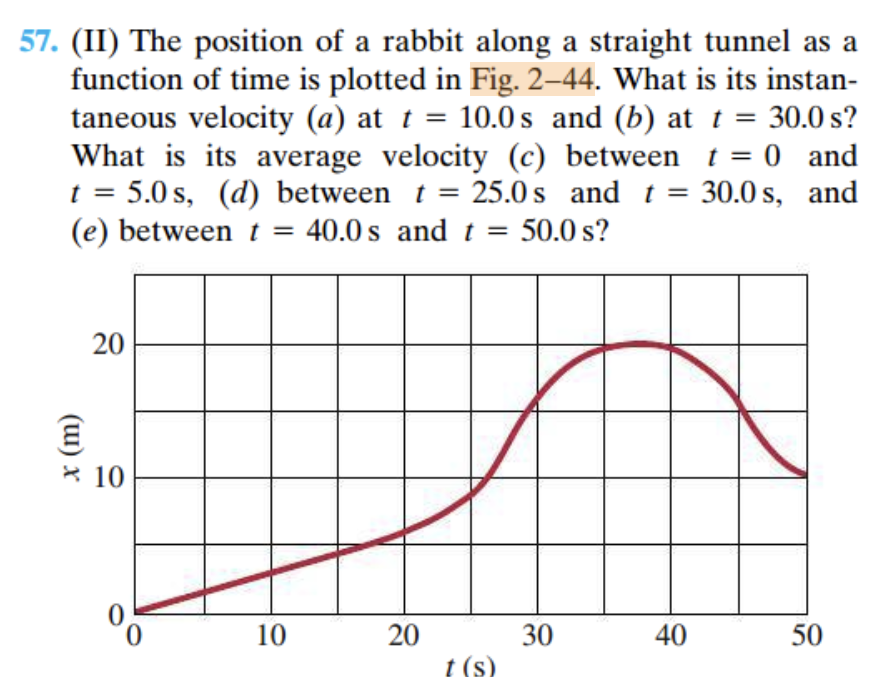
2-8 Graphical Analysis 55. (II) Figure 2-42 shows the velocity of a train as a function of time. (a) At what time was its velocity greatest? (b) During what periods, if any, was the velocity constant? (c) During what periods, if any, was the acceleration constant? (d) When was the magnitude of the acceleration greatest? 40 30 v (m/s) 20 0 10 20 30 40 50 60 70 80 90 100 110 120 t ( s )57. (II) The position of a rabbit along a straight tunnel as a function of time is plotted in Fig. 2-44. What is its instan- taneous velocity (a) at t = 10.0s and (b) at t = 30.0 s? What is its average velocity (c) between t = 0 and t = 5.0s, (d) between t = 25.0s and t = 30.0s, and (e) between t = 40.0s and t = 50.0 s? 20 (m) * 10 O 10 20 30 40 50 t (s)
Step by Step Solution
There are 3 Steps involved in it

Get step-by-step solutions from verified subject matter experts