

Question: Please type out your answer if possible, to avoid any discrepancies in handwriting. Thank you! Use proper Contribution Margin Income Statement formatting (see below). Each
Please type out your answer if possible, to avoid any discrepancies in handwriting. Thank you!
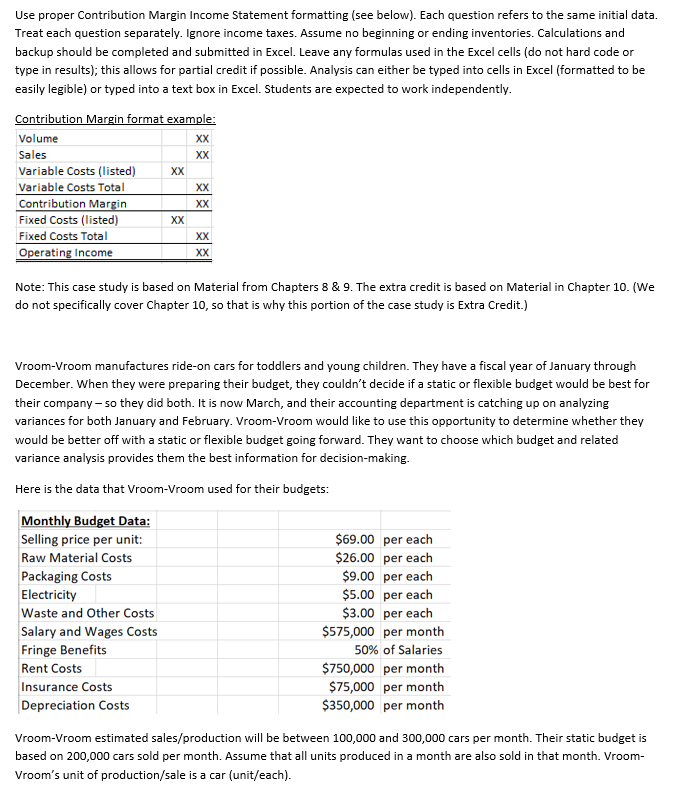
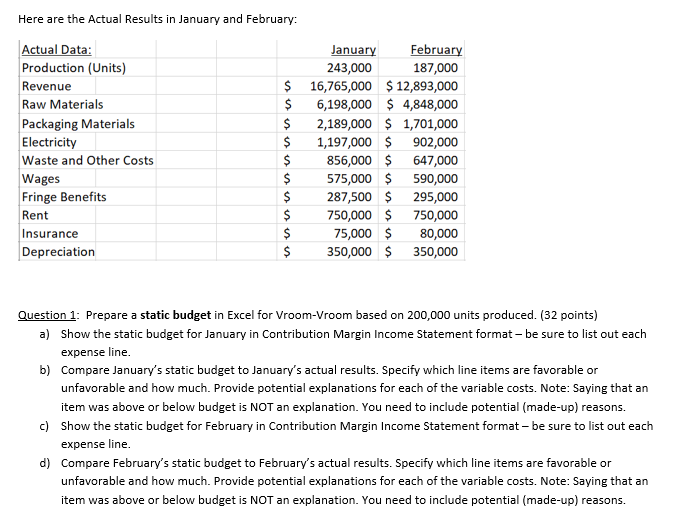
Use proper Contribution Margin Income Statement formatting (see below). Each question refers to the same initial data. Treat each question separately. Ignore income taxes. Assume no beginning or ending inventories. Calculations and backup should be completed and submitted in Excel. Leave any formulas used in the Excel cells (do not hard code or type in results); this allows for partial credit if possible. Analysis can either be typed into cells in Excel (formatted to be easily legible) or typed into a text box in Excel. Students are expected to work independently. Contribution Margin format example: Volume XX Sales XX Variable Costs (listed) XX Variable Costs Total XX Contribution Margin XX Fixed Costs (listed) XX Fixed Costs Total XX Operating Income XX Note: This case study is based on Material from Chapters 8 & 9. The extra credit is based on Material in Chapter 10. (We do not specifically cover Chapter 10, so that is why this portion of the case study is Extra Credit.) Vroom-Vroom manufactures ride-on cars for toddlers and young children. They have a fiscal year of January through December. When they were preparing their budget, they couldn't decide if a static or flexible budget would be best for their company - so they did both. It is now March, and their accounting department is catching up on analyzing variances for both January and February. Vroom-Vroom would like to use this opportunity to determine whether they would be better off with a static or flexible budget going forward. They want to choose which budget and related variance analysis provides them the best information for decision-making. Here is the data that Vroom-Vroom used for their budgets: Monthly Budget Data: Selling price per unit: Raw Material Costs Packaging Costs Electricity Waste and Other Costs Salary and Wages Costs Fringe Benefits Rent Costs Insurance Costs Depreciation Costs $69.00 per each $26.00 per each $9.00 per each $5.00 per each $3.00 per each $575,000 per month 50% of Salaries $750,000 per month $75,000 per month $350,000 per month Vroom-Vroom estimated sales/production will be between 100,000 and 300,000 cars per month. Their static budget is based on 200,000 cars sold per month. Assume that all units produced in a month are also sold in that month. Vroom- Vroom's unit of production/sale is a car (unit/each). Here are the Actual Results in January and February: Actual Data: Production (Units) Revenue Raw Materials Packaging Materials Electricity Waste and Other Costs Wages Fringe Benefits Rent Insurance Depreciation January February 243,000 187,000 $ 16,765,000 $12,893,000 $ 6,198,000 $ 4,848,000 $ 2,189,000 $ 1,701,000 $ 1,197,000 $ 902,000 $ 856,000 $ 647,000 $ 575,000 $ 590,000 $ 287,500 $ 295,000 $ 750,000 $ 750,000 $ 75,000 $ 80,000 $ 350,000 $ 350,000 Question 1: Prepare a static budget in Excel for Vroom-Vroom based on 200,000 units produced. (32 points) a) Show the static budget for January in Contribution Margin Income Statement format - be sure to list out each expense line. b) Compare January's static budget to January's actual results. Specify which line items are favorable or unfavorable and how much. Provide potential explanations for each of the variable costs. Note: Saying that an item was above or below budget is NOT an explanation. You need to include potential (made-up) reasons. c) Show the static budget for February in Contribution Margin Income Statement format - be sure to list out each expense line. d) Compare February's static budget to February's actual results. Specify which line items are favorable or unfavorable and how much. Provide potential explanations for each of the variable costs. Note: Saying that an item was above or below budget is NOT an explanation. You need to include potential (made-up) reasons. Use proper Contribution Margin Income Statement formatting (see below). Each question refers to the same initial data. Treat each question separately. Ignore income taxes. Assume no beginning or ending inventories. Calculations and backup should be completed and submitted in Excel. Leave any formulas used in the Excel cells (do not hard code or type in results); this allows for partial credit if possible. Analysis can either be typed into cells in Excel (formatted to be easily legible) or typed into a text box in Excel. Students are expected to work independently. Contribution Margin format example: Volume XX Sales XX Variable Costs (listed) XX Variable Costs Total XX Contribution Margin XX Fixed Costs (listed) XX Fixed Costs Total XX Operating Income XX Note: This case study is based on Material from Chapters 8 & 9. The extra credit is based on Material in Chapter 10. (We do not specifically cover Chapter 10, so that is why this portion of the case study is Extra Credit.) Vroom-Vroom manufactures ride-on cars for toddlers and young children. They have a fiscal year of January through December. When they were preparing their budget, they couldn't decide if a static or flexible budget would be best for their company - so they did both. It is now March, and their accounting department is catching up on analyzing variances for both January and February. Vroom-Vroom would like to use this opportunity to determine whether they would be better off with a static or flexible budget going forward. They want to choose which budget and related variance analysis provides them the best information for decision-making. Here is the data that Vroom-Vroom used for their budgets: Monthly Budget Data: Selling price per unit: Raw Material Costs Packaging Costs Electricity Waste and Other Costs Salary and Wages Costs Fringe Benefits Rent Costs Insurance Costs Depreciation Costs $69.00 per each $26.00 per each $9.00 per each $5.00 per each $3.00 per each $575,000 per month 50% of Salaries $750,000 per month $75,000 per month $350,000 per month Vroom-Vroom estimated sales/production will be between 100,000 and 300,000 cars per month. Their static budget is based on 200,000 cars sold per month. Assume that all units produced in a month are also sold in that month. Vroom- Vroom's unit of production/sale is a car (unit/each). Here are the Actual Results in January and February: Actual Data: Production (Units) Revenue Raw Materials Packaging Materials Electricity Waste and Other Costs Wages Fringe Benefits Rent Insurance Depreciation January February 243,000 187,000 $ 16,765,000 $12,893,000 $ 6,198,000 $ 4,848,000 $ 2,189,000 $ 1,701,000 $ 1,197,000 $ 902,000 $ 856,000 $ 647,000 $ 575,000 $ 590,000 $ 287,500 $ 295,000 $ 750,000 $ 750,000 $ 75,000 $ 80,000 $ 350,000 $ 350,000 Question 1: Prepare a static budget in Excel for Vroom-Vroom based on 200,000 units produced. (32 points) a) Show the static budget for January in Contribution Margin Income Statement format - be sure to list out each expense line. b) Compare January's static budget to January's actual results. Specify which line items are favorable or unfavorable and how much. Provide potential explanations for each of the variable costs. Note: Saying that an item was above or below budget is NOT an explanation. You need to include potential (made-up) reasons. c) Show the static budget for February in Contribution Margin Income Statement format - be sure to list out each expense line. d) Compare February's static budget to February's actual results. Specify which line items are favorable or unfavorable and how much. Provide potential explanations for each of the variable costs. Note: Saying that an item was above or below budget is NOT an explanation. You need to include potential (made-up) reasons
Step by Step Solution
There are 3 Steps involved in it

Get step-by-step solutions from verified subject matter experts