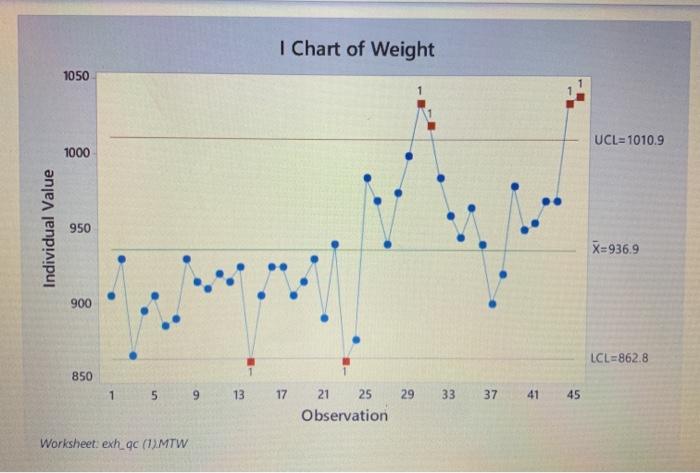
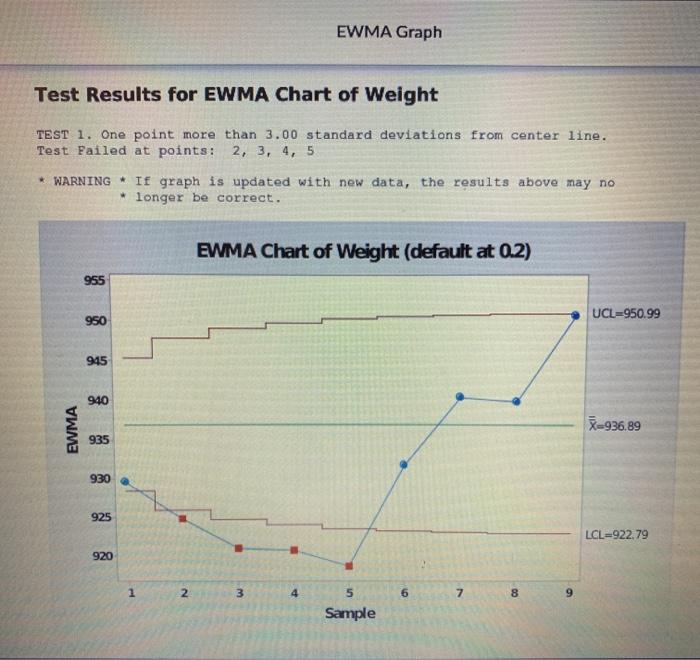
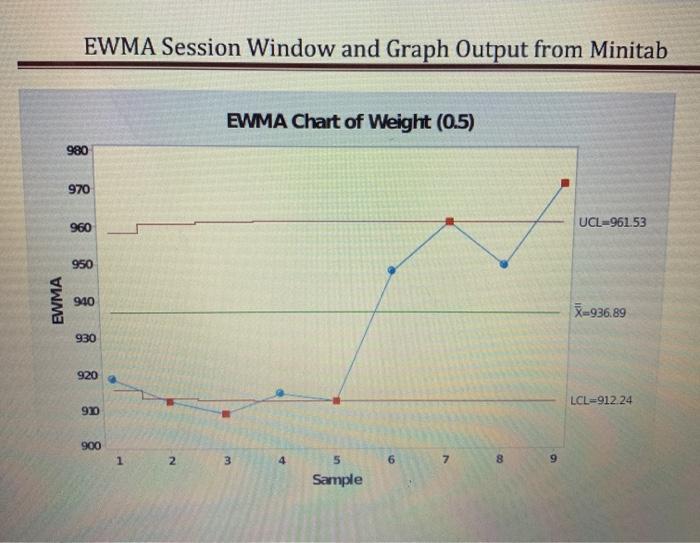
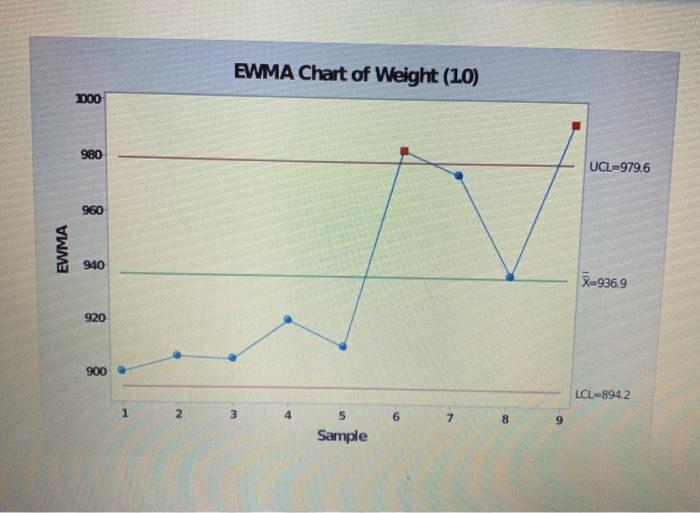
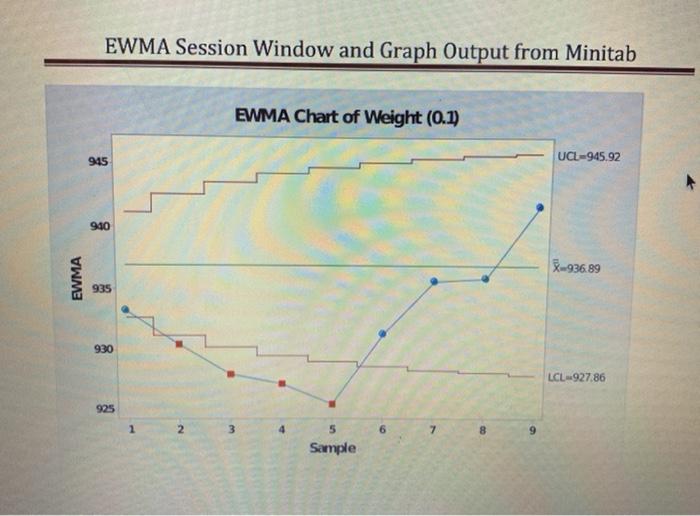
Question: please type the answer! EWMA Control Chart Exercise Individuals Chart (Shewhart) 1. Open the worksheet EXH_QC.MTW. 2. ChooseStat > Control Charts > Variables Charts for

please type the answer! please type the answer! EWMA Control Chart
please type the answer! EWMA Control Chart
EWMA Control Chart Exercise Individuals Chart (Shewhart) 1. Open the worksheet EXH_QC.MTW. 2. ChooseStat > Control Charts > Variables Charts for Individuals > Individuals. 3. EnterWeight 4. Click OK Answer the following questions 1. What points fall outside the control limits? 2. What is the upper control limit? 3. What is the lower control limit? 4. What is xbar? Interpreting the results The individuals chart shows six points outside the control limits exhibiting a nonrandom pattern, suggesting the presence of special causes. 1. EWMA ChartOpen the worksheet EXH_QC.MTW. 2. Choose Stat > Control Charts >Time-weighted Charts >EWMA. 3. ChooseAll observations for a chart are in one column, then enterWeight 4. In Subgroup sizes, enter 5. ClickOK EWMA Control Chart Exercise Answer the following questions 1. What points fall outside the control limits? 2. What is the upper controllimit? 3. What is the lower controllimit? 4. What is xbar? Interpreting the results 1. The EWMAs for sample numbers 2, 3, 4, and 5 fall more than 3 standard deviations below the center line, suggesting small shifts away from the target 2. What do you notice about the control limits in both charts? 3. Change the weight in the EMWA chart to 0.5, 1.0, 0.1, what do you notice I Chart of Weight 1050 1 UCL=1010.9 1000 Individual Value 950 X=936.9 900 LCL=862.8 850 1 5 9 13 17 29 33 37 41 45 21 25 Observation Worksheet: exh9c (1) MTW EWMA Graph Test Results for EWMA Chart of Weight TEST 1. One point more than 3.00 standard deviations from center line. Test Failed at points: 2, 3, 4, 5 * WARNING * If graph is updated with new data, the results above may no * longer be correct. EWMA Chart of Weight (default at 0.2) 955 UCL=950.99 950 945 940 EWMA -936.89 935 930 925 LCL=922 79 920 1 1 N 3 4 6 7 00 9 5 Sample EWMA Session Window and Graph Output from Minitab EWMA Chart of Weight (0.5) 980 970 960 UCL961.53 950 EWMA 940 =936.89 930 920 LE=91224 90 900 1 N 3 4 5 6 7 8 9 Sample EWMA Chart of Weight (10) 100 980 UCL-979.6 960 EWMA 940 X=936.9 920 900 LCL 894 2 1 2 3 4 6 7 8 5 Sample EWMA Session Window and Graph Output from Minitab EWMA Chart of Weight (0.1) 945 UCL-945.92 940 8-936.89 EWMA 935 930 LCa92786 925 2 3 5 7 8 Sample

Step by Step Solution

There are 3 Steps involved in it

1 Expert Approved Answer
Step: 1 Unlock blur-text-image
Question Has Been Solved by an Expert!

Get step-by-step solutions from verified subject matter experts

Step: 2 Unlock
Step: 3 Unlock

Students Have Also Explored These Related General Management Questions!