

Question: please type the answer Q18. If x is varying between -2n to 27, write the MATLAB program commands that will plot this figure. (4 marks)
please type the answer 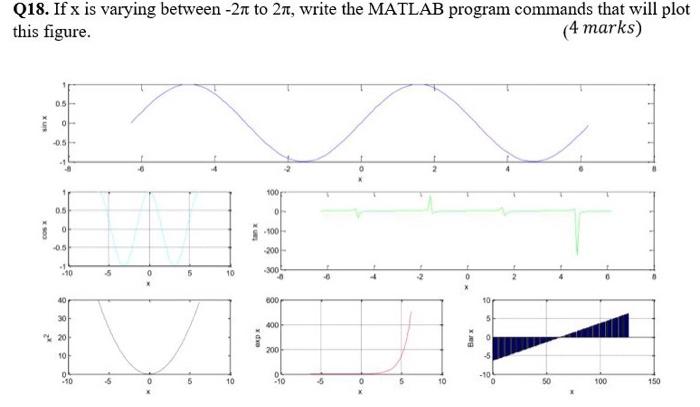
Q18. If x is varying between -2n to 27, write the MATLAB program commands that will plot this figure. (4 marks) 05 o 05 . 100 0.5 ON ol 05 2001- . .10 5 5 10 -300 40 000 10 301 400 201 200 101 0 -6 0 5 10 -10 5 10 13 100 150
Step by Step Solution
There are 3 Steps involved in it
1 Expert Approved Answer
Step: 1 Unlock

Question Has Been Solved by an Expert!
Get step-by-step solutions from verified subject matter experts
Step: 2 Unlock
Step: 3 Unlock