

Question: Please Type the answers through formulas where it's required. Below are the segment financial data reported by Disney: (1) Forecast Revenues for FY 2022E using
Please Type the answers through formulas where it's required.
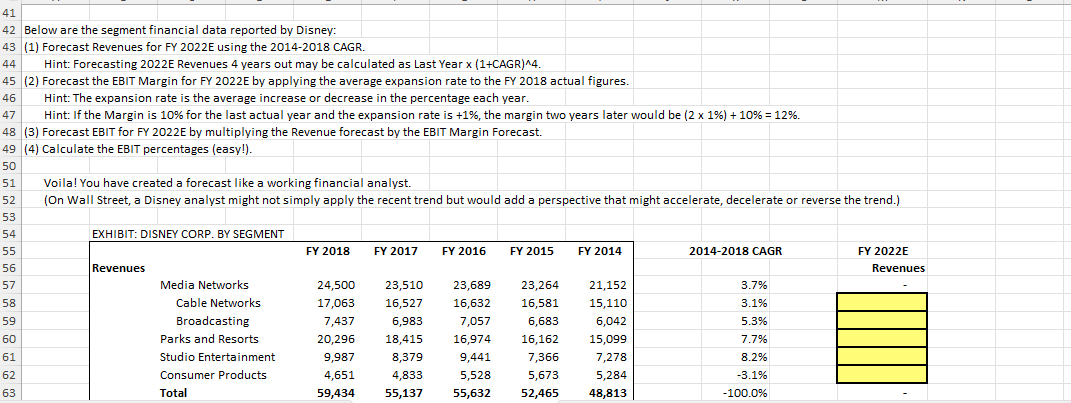
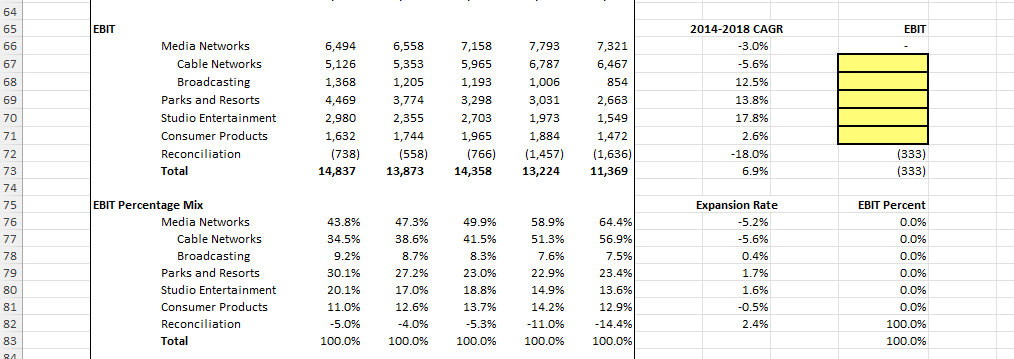
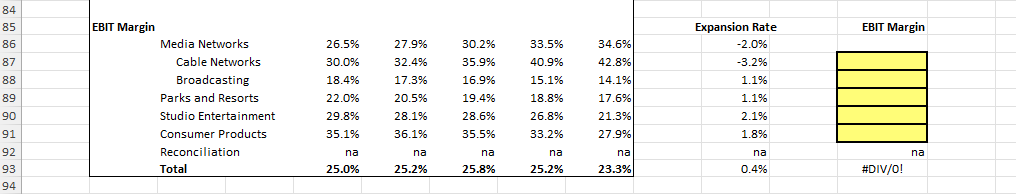
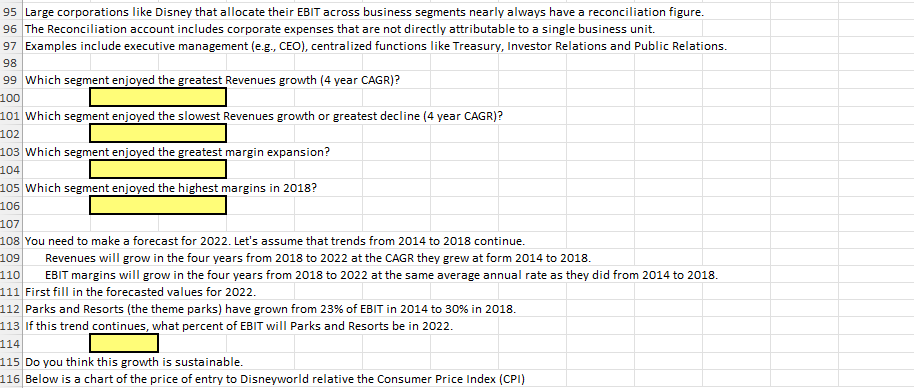
Below are the segment financial data reported by Disney: (1) Forecast Revenues for FY 2022E using the 2014-2018 CAGR. Hint: Forecasting 2022E Revenues 4 years out may be calculated as Last Year x(1+CAGR)4. (2) Forecast the EBIT Margin for FY 2022E by applying the average expansion rate to the FY 2018 actual figures. Hint: The expansion rate is the average increase or decrease in the percentage each year. Hint: If the Margin is 10% for the last actual year and the expansion rate is +1%, the margin two years later would be (21%)+10%=12%. (3) Forecast EBIT for FY 2022E by multiplying the Revenue forecast by the EBIT Margin Forecast. (4) Calculate the EBIT percentages (easy!). \begin{tabular}{|c|c|c|c|c|c|c|c|c|} \hline \multicolumn{9}{|c|}{84} \\ \hline 85 & \multicolumn{6}{|l|}{ EBIT Margin } & Expansion Rate & EBIT Margin \\ \hline 86 & Media Networks & 26.5% & 27.9% & 30.2% & 33.5% & 34.6% & 2.0% & \\ \hline 87 & Cable Networks & 30.0% & 32.4% & 35.9% & 40.9% & 42.8% & 3.2% & \\ \hline 88 & Broadcasting & 18.4% & 17.3% & 16.9% & 15.1% & 14.1% & 1.1% & \\ \hline 89 & Parks and Resorts & 22.0% & 20.5% & 19.4% & 18.8% & 17.6% & 1.1% & \\ \hline 90 & Studio Entertainment & 29.8% & 28.1% & 28.6% & 26.8% & 21.3% & 2.1% & \\ \hline 91 & Consumer Products & 35.1% & 36.1% & 35.5% & 33.2% & 27.9% & 1.8% & \\ \hline 92 & Reconciliation & na & na & na & na & na & na & na \\ \hline 93 & Total & 25.0% & 25.2% & 25.8% & 25.2% & 23.3% & 0.4% & \#DIV/O! \\ \hline \end{tabular} 95 Large corporations like Disney that allocate their EBIT across business segments nearly always have a reconciliation figure. The Reconciliation account includes corporate expenses that are not directly attributable to a single business unit. Examples include executive management (e.g., CEO), centralized functions like Treasury, Investor Relations and Public Relations. Which segment enjoyed the greatest Revenues growth (4 year CAGR)? Which segment enjoyed the slowest Revenues growth or greatest decline (4 year CAGR)? Which segment enjoyed the greatest margin expansion? Which segment enjoyed the highest margins in 2018 ? You need to make a forecast for 2022. Let's assume that trends from 2014 to 2018 continue. Revenues will grow in the four years from 2018 to 2022 at the CAGR they grew at form 2014 to 2018 . EBIT margins will grow in the four years from 2018 to 2022 at the same average annual rate as they did from 2014 to 2018. First fill in the forecasted values for 2022. Parks and Resorts (the theme parks) have grown from 23\% of EBIT in 2014 to 30% in 2018. If this trend continues, what percent of EBIT will Parks and Resorts be in 2022. Do you think this growth is sustainable. Below is a chart of the price of entry to Disneyworld relative the Consumer Price Index (CPI)
Step by Step Solution
There are 3 Steps involved in it

Get step-by-step solutions from verified subject matter experts