

Question: ******** Please updated question for graph in the previous post*************** Select the correct graph for the NPV profiles for Plan A, Plan B, and Project
******** Please updated question for graph in the previous post***************
Select the correct graph for the NPV profiles for Plan A, Plan B, and Project .
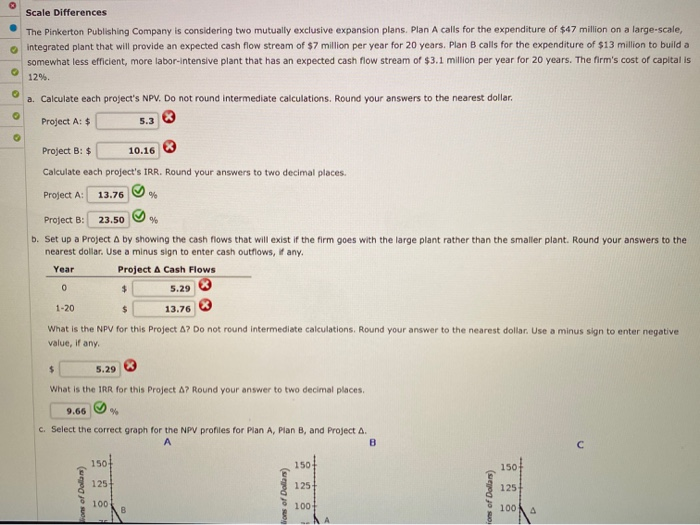
Scale Differences The Pinkerton Publishing Company is considering two mutually exclusive expansion plans. Plan A calls for the expenditure of $47 million on a large-scale, integrated plant that will provide an expected cash flow stream of $7 million per year for 20 years. Plan B calls for the expenditure of $13 million to build a somewhat less efficient, more labor-intensive plant that has an expected cash flow stream of $3.1 million per year for 20 years. The firm's cost of capital is 12%. a. Calculate each project's NPV. Do not round intermediate calculations. Round your answers to the nearest dollar. Project A: $ 5.33 Project B: $ 10.16 Calculate each project's IRR. Round your answers to two decimal places. Project A: 13.76 % Project B: 23.50 % b. Set up a Project A by showing the cash flows that will exist if the firm goes with the large plant rather than the smaller plant. Round your answers to the nearest dollar. Use a minus sign to enter cash outflows, if any. Year Project A Cash Flows 0 $ 5.29 1-20 $ 13.76 What is the NPV for this project A? Do not round intermediate calculations. Round your answer to the nearest dollar. Use a minus sign to enter negative value, if any. $ 5.29 What is the IRR for this project A? Round your answer to two decimal places 9.66 % C. Select the correct graph for the NPV profiles for Plan A, Plan B, and Project a. A B 150 150 150 125 ons of Dollars) 125 125 Bons of Dollars) ons of Dollars) 100 100 100 Scale Differences The Pinkerton Publishing Company is considering two mutually exclusive expansion plans. Plan A calls for the expenditure of $47 million on a large-scale, integrated plant that will provide an expected cash flow stream of $7 million per year for 20 years. Plan B calls for the expenditure of $13 million to build a somewhat less efficient, more labor-intensive plant that has an expected cash flow stream of $3.1 million per year for 20 years. The firm's cost of capital is 12%. a. Calculate each project's NPV. Do not round intermediate calculations. Round your answers to the nearest dollar. Project A: $ 5.33 Project B: $ 10.16 Calculate each project's IRR. Round your answers to two decimal places. Project A: 13.76 % Project B: 23.50 % b. Set up a Project A by showing the cash flows that will exist if the firm goes with the large plant rather than the smaller plant. Round your answers to the nearest dollar. Use a minus sign to enter cash outflows, if any. Year Project A Cash Flows 0 $ 5.29 1-20 $ 13.76 What is the NPV for this project A? Do not round intermediate calculations. Round your answer to the nearest dollar. Use a minus sign to enter negative value, if any. $ 5.29 What is the IRR for this project A? Round your answer to two decimal places 9.66 % C. Select the correct graph for the NPV profiles for Plan A, Plan B, and Project a. A B 150 150 150 125 ons of Dollars) 125 125 Bons of Dollars) ons of Dollars) 100 100 100
Step by Step Solution
There are 3 Steps involved in it

Get step-by-step solutions from verified subject matter experts