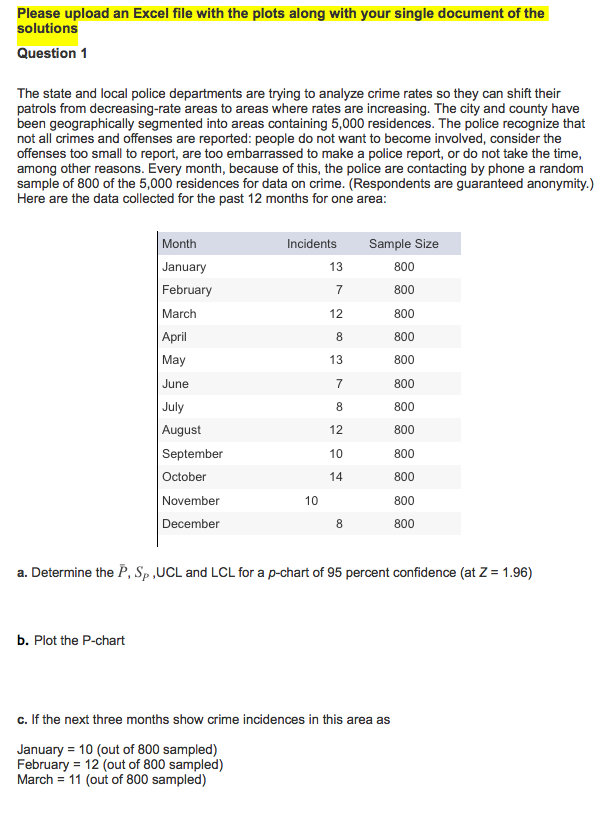
Question: Please upload an Excel file with the plots along with your single document of the solutions Question 1 The state and local police departments are

Please upload an Excel file with the plots along

Please upload an Excel file with the plots along with your single document of the solutions Question 1 The state and local police departments are trying to analyze crime rates so they can shift their patrols from decreasing-rate areas to areas where rates are increasing. The city and county have been geographically segmented into areas containing 5,000 residences. The police recognize that not all crimes and offenses are reported: people do not want to become involved, consider the offenses too small to report, are too embarrassed to make a police report, or do not take the time, among other reasons. Every month, because of this, the police are contacting by phone a random sample of 800 of the 5,000 residences for data on crime. (Respondents are guaranteed anonymity.) Here are the data collected for the past 12 months for one area: Incidents 13 Sample Size 800 7 800 Month January February March April May 12 800 8 13 800 800 800 June 7 8 800 12 800 10 800 July August September October November December 14 10 800 800 800 8 a. Determine the P, Sp,UCL and LCL for a p-chart of 95 percent confidence (at Z = 1.96) b. Plot the P-chart c. If the next three months show crime incidences in this area as January = 10 (out of 800 sampled) February = 12 (out of 800 sampled) March = 11 (out of 800 sampled)

Step by Step Solution

There are 3 Steps involved in it

1 Expert Approved Answer
Step: 1 Unlock blur-text-image
Question Has Been Solved by an Expert!

Get step-by-step solutions from verified subject matter experts

Step: 2 Unlock
Step: 3 Unlock

Students Have Also Explored These Related General Management Questions!