

Question: PLEASE UPLOAD EXCEL FILE!!!!!!!!!!!!!!!!!!!!!!!!! Use Excel to produce a Histogram. Show all of your calculations for this grouped data on an Excel file. All work
PLEASE UPLOAD EXCEL FILE!!!!!!!!!!!!!!!!!!!!!!!!! Use Excel to produce a Histogram.
Show all of your calculations for this grouped data on an Excel file. All work must be supported with and Excel file. If the Excel file is not provided, the student will receive zero credit.
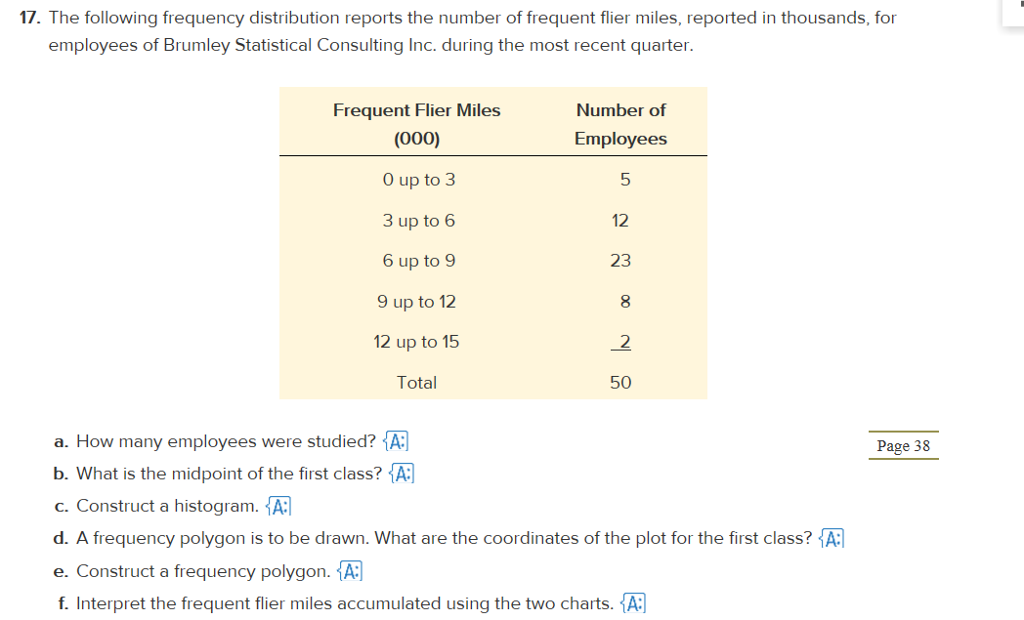
17. The following frequency distribution reports the number of frequent flier miles, reported in thousands, for employees of Brumley Statistical Consulting Inc. during the most recent quarter. Frequent Flier Miles (000) 0 up to 3 3 up to 6 6 up to 9 9 up to 12 12 up to 15 Number of Employees 5 12 23 2 50 a. How many employees were studied?! b. What is the midpoint of the first class? A c. Construct a histogram. A: d. A frequency polygon is to be drawn. What are the coordinates of the plot for the first class? A: e. Construct a frequency polygon. A f. Interpret the frequent flier miles accumulated using the two charts. A Page 38
Step by Step Solution
There are 3 Steps involved in it

Get step-by-step solutions from verified subject matter experts