

Question: Please upload R code (in RStudio is fine) for the questions. Thank you! 1. Biologists studying the healing of skin wounds measured the rate at
Please upload R code (in RStudio is fine) for the questions. Thank you!
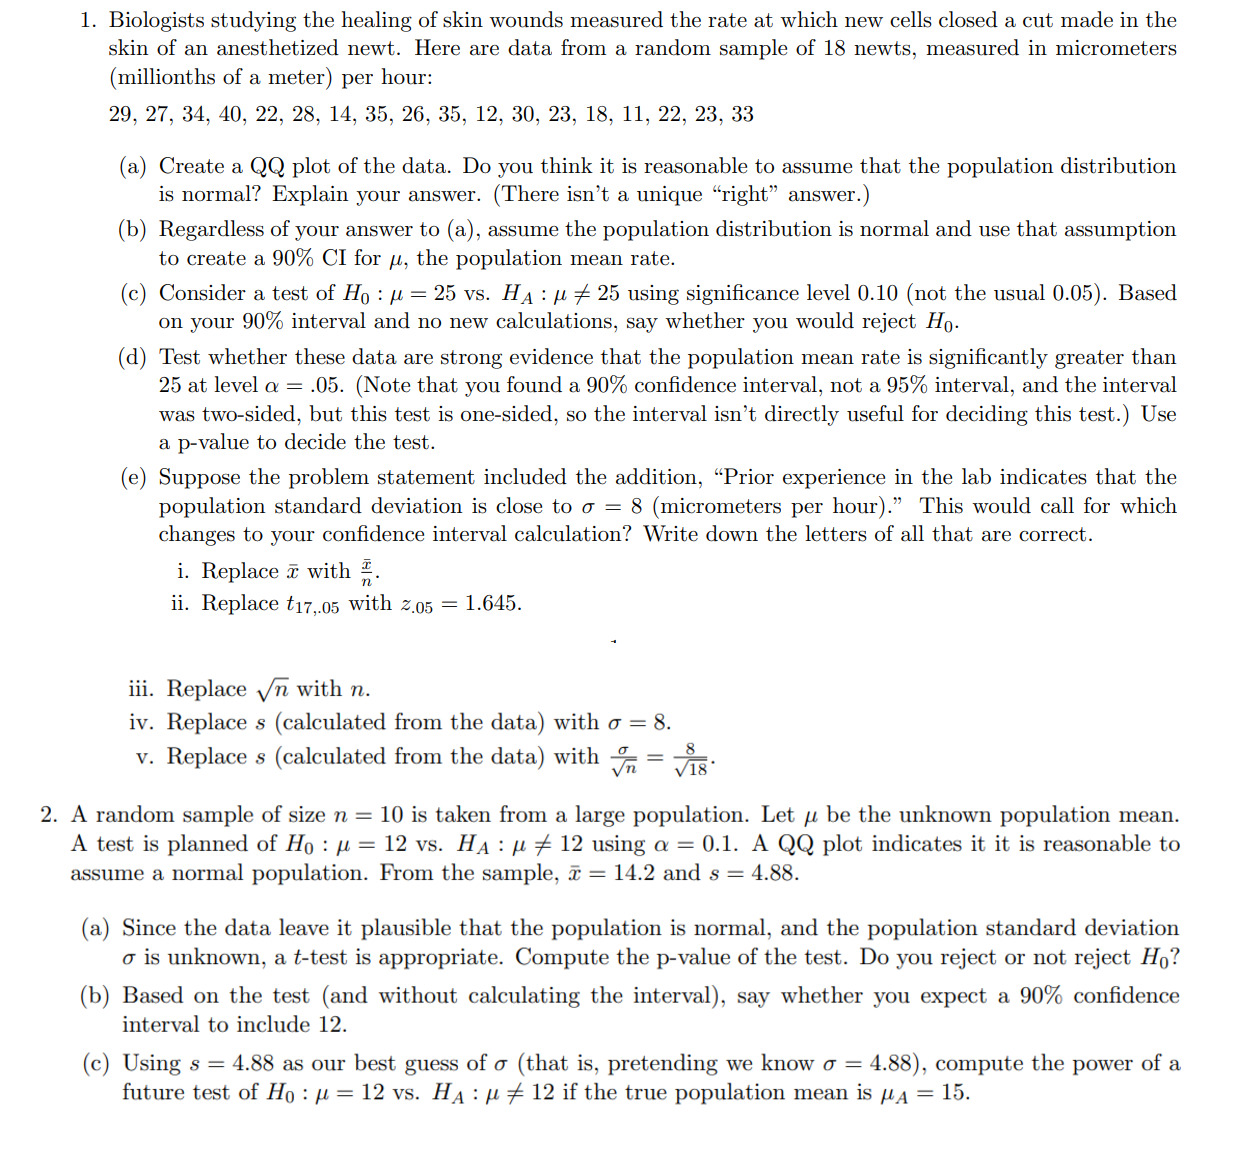
1. Biologists studying the healing of skin wounds measured the rate at which new cells closed a cut made in the skin of an anesthetized newt. Here are data from a random sample of 18 newts, measured in micrometers (millionths of a meter) per hour: 29, 27, 34, 40, 22, 28, 14, 35, 26, 35, 12, 30, 23, 18, 11, 22, 23, 33 (a) Create a QQ plot of the data. Do you think it is reasonable to assume that the population distribution is normal? Explain your answer. (There isn't a unique \"right\" answer.) (b) Regardless of your answer to (a), assume the population distribution is normal and use that assumption to create a 90% CI for a, the population mean rate. (c) Consider a test of H0 : ,u = 25 vs. HA : ,u 75 25 using signicance level 0.10 (not the usual 0.05). Based on your 90% interval and no new calculations, say whether you would reject H\". (d) Test whether these data are strong evidence that the population mean rate is signicantly greater than 25 at level a = .05. (Note that you found a 90% condence interval, not a 95% interval, and the interval was two-sided, but this test is one-sided, so the interval isn't directly useful for deciding this test.) Use a p-value to decide the test. (e) Suppose the problem statement included the addition, \"Prior experience in the lab indicates that the population standard deviation is close to 0' = 8 (micrometers per hour).\" This would call for which changes to your condence interval calculation? Write down the letters of all that are correct. i. Replace 1% with i. ii. Replace #317535 with 2135 = 1.645. iii. Replace with 71. iv. Replace .9 (calculated from the data) with (I = 8. v. Replace .9 (calculated from the data) with 57 = 9%,. 2. A random sample of size n = 10 is taken from a large population. Let a be the unknown population mean. A test is planned of Hg : a = 12 vs. HA : a 7 12 using a = 0.1. A QQ plot indicates it it is reasonable to assume a normal population. From the sample, :1: = 14.2 and s = 4.88. (a) Since the data leave it plausible that. the population is normal, and the population standard deviation 0' is unknown, a t-test is appropriate. Compute the p-value of the test. Do you reject or not reject Hg? (b) Based on the test (and without calculating the interval). say whether you expect. a 90% condence interval to include 12. (c) Using 8 = 4.88 as our best. guess of a (that is, pretending we know 0' = 4.88), compute the power of a future test. of H0 : p = 12 vs. HA : ,u % 12 if the true population mean is ,u...' = 15
Step by Step Solution
There are 3 Steps involved in it

Get step-by-step solutions from verified subject matter experts