

Question: Please upload the MATLAB script. 1. (5 points) The annual sales data for various models of Ford SUVs from 2006 to 2015 is provided below:
 Please upload the MATLAB script.
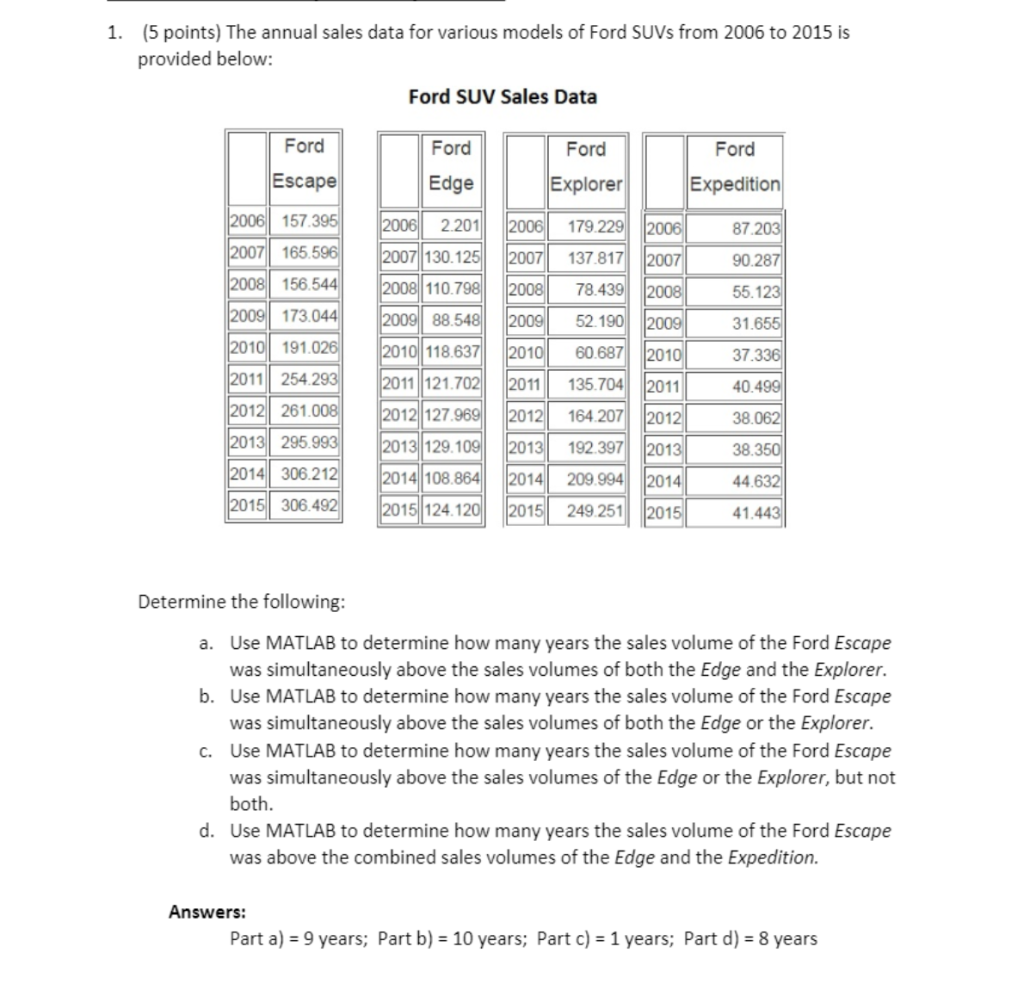
1. (5 points) The annual sales data for various models of Ford SUVs from 2006 to 2015 is provided below: Ford SUV Sales Data Ford Ford Ford Ford Escape Edge Explorer Expedition 2006 157.395 2006 87.203 2006 2201 2007 130.125 2007 | 165.596 2007 90.287 2008 | 156.544 2008 110.798 2008 55.123 2009 173.044 2009 88.548 2009 31.655 2010 191.026 2010 37.336 2010 | 118.637 2011 (121.702 179 229 2006 137.817 2007 78.439 2008 52.190 2009 60.687 2010 135.704 2011 164 207 2012 192.397 2013 209.994 2014 249 251 2015 2011 254.293 2011 40.499 2012 261.008 2012 (127.969 2012 38.062 2013 295.993 38.350 2013 (129. 109 2014|108.864 2014| 306.212 2013 2014 44.632 2015| 306.492 2015||124.120 2015 41.443 Determine the following: a. Use MATLAB to determine how many years the sales volume of the Ford Escape was simultaneously above the sales volumes of both the Edge and the Explorer. b. Use MATLAB to determine how many years the sales volume of the Ford Escape was simultaneously above the sales volumes of both the Edge or the Explorer. C. Use MATLAB to determine how many years the sales volume of the Ford Escape was simultaneously above the sales volumes of the Edge or the Explorer, but not both. d. Use MATLAB to determine how many years the sales volume of the Ford Escape was above the combined sales volumes of the Edge and the Expedition. Answers: Part a) = 9 years; Part b) = 10 years; Part c) = 1 years; Part d) = 8 years
Step by Step Solution
There are 3 Steps involved in it

Get step-by-step solutions from verified subject matter experts