

Question: Please use a spreadsheet software. The performance function for a distillation tower is given in Figure Q2.8 in terms of lost profit from the best
 Please use a spreadsheet software.
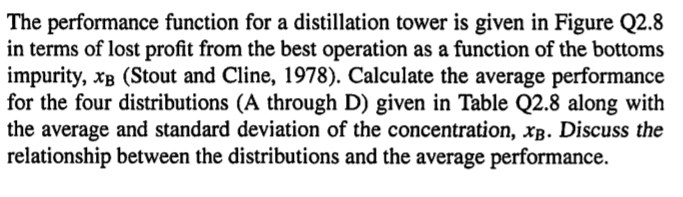
The performance function for a distillation tower is given in Figure Q2.8 in terms of lost profit from the best operation as a function of the bottoms impurity, XB (Stout and Cline, 1978). Calculate the average performance for the four distributions (A through D) given in Table Q2.8 along with the average and standard deviation of the concentration, XB. Discuss the relationship between the distributions and the average performance. 0.00 -10.00 TABLE Q2.8 Fraction of time at Xp XB A B D -12 -20.00 PP (P) -26 -30.00 Performance penalty, $/day -40.00 0.25 0.5 0.75 1.0 1.5 2.0 -50.00 -50 0 0.25 0.50 0.25 0 0 0 0 0 0 0 0 0.05 0 0.05 0 0.10 0 0.20 0 0.30 0 0.20 0.25 0.10 0.50 0 0.25 0 0 0 0 - 27 0 -25 0 -12 0.333-4 0.333 0 0.333 -10 0 26 0 -50 0 -60.00 -64 3.0 - 70.00 0.00 1.00 5.00 6.00 2.00 3.00 4.00 Bottoms impurity, #B 4.0 5.0 6.0 -64
Step by Step Solution
There are 3 Steps involved in it

Get step-by-step solutions from verified subject matter experts