

Question: Please use an excel spreadsheet for this: Make an xbar chart and r chart. 1. The following table charts the output of a manufacturing process
Please use an excel spreadsheet for this: 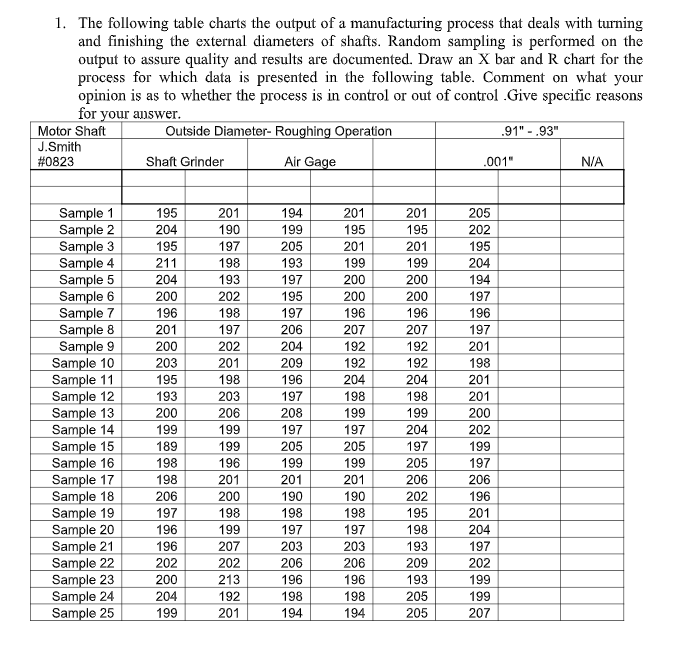
Make an xbar chart and r chart.
1. The following table charts the output of a manufacturing process that deals with turning and finishing the external diameters of shafts. Random sampling is performed on the output to assure quality and results are documented. Draw an X bar and R chart for the process for which data is presented in the following table. Comment on what your opinion is as to whether the process is in control or out of control .Give specific reasons for your answer. Motor Shaft Outside Diameter-Roughing Operation .91" - .93" J.Smith #0823 Shaft Grinder Air Gage N/A .001" Sample 1 Sample 2 Sample 3 Sample 4 Sample 5 Sample 6 Sample 7 Sample 8 Sample 9 Sample 10 Sample 11 Sample 12 Sample 13 Sample 14 Sample 15 Sample 16 Sample 17 Sample 18 Sample 19 Sample 20 Sample 21 Sample 22 Sample 23 Sample 24 Sample 25 195 204 195 211 204 200 196 201 200 203 195 193 200 199 189 198 198 206 197 196 196 202 200 204 199 201 190 197 198 193 202 198 197 202 201 198 203 206 199 199 196 201 200 198 199 207 202 213 192 201 194 199 205 193 197 195 197 206 204 209 196 197 208 197 205 199 201 190 198 197 203 206 196 198 194 201 195 201 199 200 200 196 207 192 192 204 198 199 197 205 199 201 195 201 199 200 200 196 207 192 192 204 198 199 204 197 205 206 202 195 198 193 209 193 205 205 205 202 195 204 194 197 196 197 201 198 201 201 200 202 199 197 206 196 201 204 197 202 199 199 207 190 198 197 203 206 196 198 194
Step by Step Solution
There are 3 Steps involved in it
1 Expert Approved Answer
Step: 1 Unlock

Question Has Been Solved by an Expert!
Get step-by-step solutions from verified subject matter experts
Step: 2 Unlock
Step: 3 Unlock