

Question: Please use chart below to answer both questions, thank you. begin{tabular}{|c|r|r|} hline Year & A & B hline 1 & 12% & 2%
Please use chart below to answer both questions, thank you.
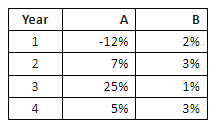
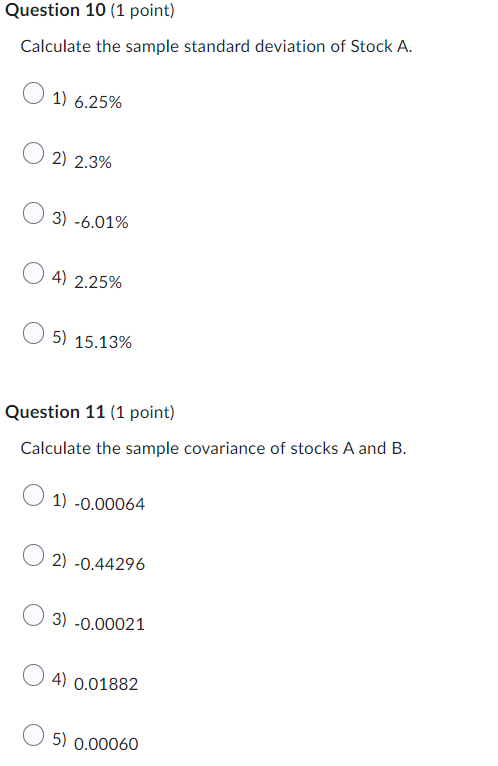
\begin{tabular}{|c|r|r|} \hline Year & A & B \\ \hline 1 & 12% & 2% \\ \hline 2 & 7% & 3% \\ \hline 3 & 25% & 1% \\ \hline 4 & 5% & 3% \\ \hline \end{tabular} Calculate the sample standard deviation of Stock A. 1) 6.25% 2) 2.3% 3) 6.01% 4) 2.25% 5) 15.13% Question 11 (1 point) Calculate the sample covariance of stocks A and B. 1) -0.00064 2) -0.44296 3) -0.00021 4) 0.01882 5) 0.00060 \begin{tabular}{|c|r|r|} \hline Year & A & B \\ \hline 1 & 12% & 2% \\ \hline 2 & 7% & 3% \\ \hline 3 & 25% & 1% \\ \hline 4 & 5% & 3% \\ \hline \end{tabular} Calculate the sample standard deviation of Stock A. 1) 6.25% 2) 2.3% 3) 6.01% 4) 2.25% 5) 15.13% Question 11 (1 point) Calculate the sample covariance of stocks A and B. 1) -0.00064 2) -0.44296 3) -0.00021 4) 0.01882 5) 0.00060
Step by Step Solution
There are 3 Steps involved in it

Get step-by-step solutions from verified subject matter experts