

Question: please use Excel and explain how to create the charts 5-2. A high-voltage power supply should have a nominal output voltage of 350 V. A
please use Excel and explain how to create the charts 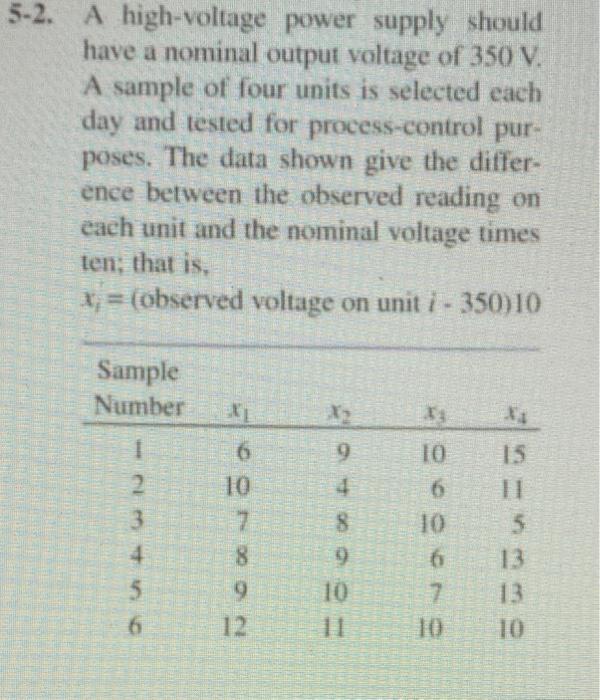
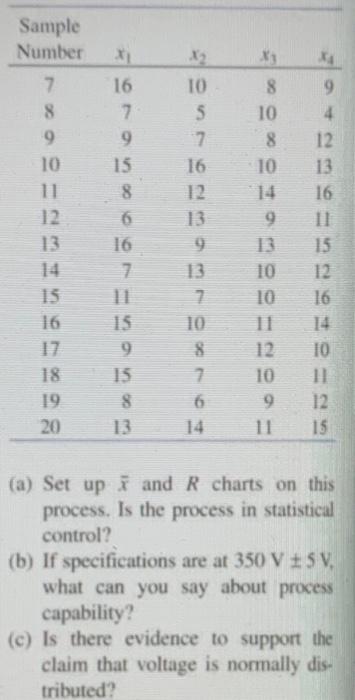
5-2. A high-voltage power supply should have a nominal output voltage of 350 V. A sample of four units is selected each day and tested for process-control pur- poses. The data shown give the differ- ence between the observed reading on each unit and the nominal voltage times ten; that is, x;= (observed voltage on uniti - 350)10 Sample Number 1 2. 3 4 5. 6 6 10 17 8 9 9 4 8 9 10 10 6 10 6 17 10 = 13 10 Xy . 8 9 4 10 12 13 Sample Number 7 8 9 10 11 12 13 14 15 16 17 16 7 9 15 8 6 16 7. 16 10 5 17 16 12 13 9 13 7 10 8 7 6 14 8 10 14 9 13 10 10 11 12 10 9 11 15 9 15 12 16 14 10 11 12 15 18 15 19 20 8 13 (a) Set up and R charts on this process. Is the process in statistical control? (b) If specifications are at 350 V +5V, what can you say about process capability? (c) Is there evidence to support the claim that voltage is normally dis- tributed Step by Step Solution
There are 3 Steps involved in it
1 Expert Approved Answer
Step: 1 Unlock

Question Has Been Solved by an Expert!
Get step-by-step solutions from verified subject matter experts
Step: 2 Unlock
Step: 3 Unlock