

Question: Please use excel and include pictures! There are 12 possible shipment routes, and for every plantwarehouse combination, the unit shipping cost is known. The product
Please use excel and include pictures!
There are 12 possible shipment routes, and for every plantwarehouse combination, the unit shipping cost is known. 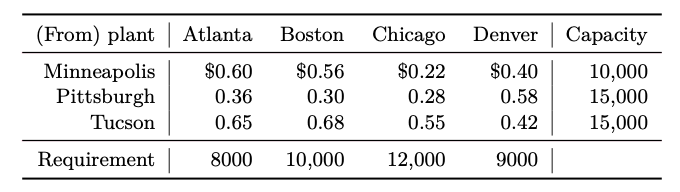
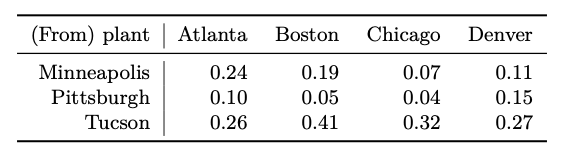
The product is subject to evaporation in the tanker trucks used for distribution purposes. The average amount of evaporation depends on the distance traveled and the average temperature. The following table shows the corresponding yield loss as it has been observed to occur on each of its shipping routes.
1. What is the minimum shipping cost and the associated optimal shipping schedule?
2. A new type of tanker truck can completely eliminate yield loss. If the manufacturer can replace its fleet with the new trucks, how much can it save on shipping costs (with possibly a new schedule)? How should it change the optimal shipping schedule?
\begin{tabular}{r|rrrr|r} \hline (From) plant & Atlanta & Boston & Chicago & Denver & Capacity \\ \hline Minneapolis & $0.60 & $0.56 & $0.22 & $0.40 & 10,000 \\ Pittsburgh & 0.36 & 0.30 & 0.28 & 0.58 & 15,000 \\ Tucson & 0.65 & 0.68 & 0.55 & 0.42 & 15,000 \\ \hline Requirement & 8000 & 10,000 & 12,000 & 9000 & \\ \hline \end{tabular} \begin{tabular}{r|rrrr} \hline (From) plant & Atlanta & Boston & Chicago & Denver \\ \hline Minneapolis & 0.24 & 0.19 & 0.07 & 0.11 \\ Pittsburgh & 0.10 & 0.05 & 0.04 & 0.15 \\ Tucson & 0.26 & 0.41 & 0.32 & 0.27 \\ \hline \end{tabular} \begin{tabular}{r|rrrr|r} \hline (From) plant & Atlanta & Boston & Chicago & Denver & Capacity \\ \hline Minneapolis & $0.60 & $0.56 & $0.22 & $0.40 & 10,000 \\ Pittsburgh & 0.36 & 0.30 & 0.28 & 0.58 & 15,000 \\ Tucson & 0.65 & 0.68 & 0.55 & 0.42 & 15,000 \\ \hline Requirement & 8000 & 10,000 & 12,000 & 9000 & \\ \hline \end{tabular} \begin{tabular}{r|rrrr} \hline (From) plant & Atlanta & Boston & Chicago & Denver \\ \hline Minneapolis & 0.24 & 0.19 & 0.07 & 0.11 \\ Pittsburgh & 0.10 & 0.05 & 0.04 & 0.15 \\ Tucson & 0.26 & 0.41 & 0.32 & 0.27 \\ \hline \end{tabular}
Step by Step Solution
There are 3 Steps involved in it

Get step-by-step solutions from verified subject matter experts