

Question: Please use excel and provide formulas Question Set 3. A Grocery store has a production target of 1000 units of Milk, Bread and Eggs each
Please use excel and provide formulas
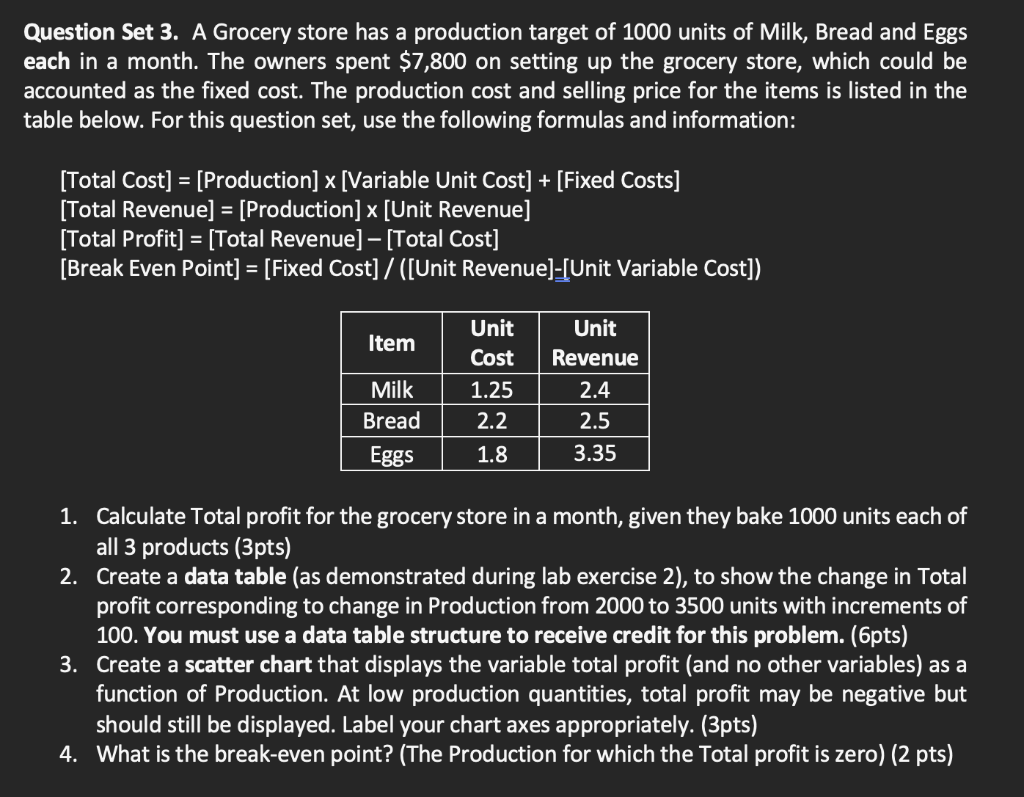
Question Set 3. A Grocery store has a production target of 1000 units of Milk, Bread and Eggs each in a month. The owners spent $7,800 on setting up the grocery store, which could be accounted as the fixed cost. The production cost and selling price for the items is listed in the table below. For this question set, use the following formulas and information: [ Total Cost ]=[ Production ][ Variable Unit Cost ]+[ Fixed Costs ] [Total Revenue] =[ Production ] x [Unit Revenue ] [ Total Profit ]=[ Total Revenue ][ Total Cost ] [Break Even Point ]=[ Fixed Cost ]/ ([Unit Revenue]-[Unit Variable Cost ] ) 1. Calculate Total profit for the grocery store in a month, given they bake 1000 units each of all 3 products ( 3pts) 2. Create a data table (as demonstrated during lab exercise 2), to show the change in Total profit corresponding to change in Production from 2000 to 3500 units with increments of 100. You must use a data table structure to receive credit for this problem. (6pts) 3. Create a scatter chart that displays the variable total profit (and no other variables) as a function of Production. At low production quantities, total profit may be negative but should still be displayed. Label your chart axes appropriately. (3pts) 4. What is the break-even point? (The Production for which the Total profit is zero) (2 pts) Question Set 3. A Grocery store has a production target of 1000 units of Milk, Bread and Eggs each in a month. The owners spent $7,800 on setting up the grocery store, which could be accounted as the fixed cost. The production cost and selling price for the items is listed in the table below. For this question set, use the following formulas and information: [ Total Cost ]=[ Production ][ Variable Unit Cost ]+[ Fixed Costs ] [Total Revenue] =[ Production ] x [Unit Revenue ] [ Total Profit ]=[ Total Revenue ][ Total Cost ] [Break Even Point ]=[ Fixed Cost ]/ ([Unit Revenue]-[Unit Variable Cost ] ) 1. Calculate Total profit for the grocery store in a month, given they bake 1000 units each of all 3 products ( 3pts) 2. Create a data table (as demonstrated during lab exercise 2), to show the change in Total profit corresponding to change in Production from 2000 to 3500 units with increments of 100. You must use a data table structure to receive credit for this problem. (6pts) 3. Create a scatter chart that displays the variable total profit (and no other variables) as a function of Production. At low production quantities, total profit may be negative but should still be displayed. Label your chart axes appropriately. (3pts) 4. What is the break-even point? (The Production for which the Total profit is zero) (2 pts)
Step by Step Solution
There are 3 Steps involved in it

Get step-by-step solutions from verified subject matter experts