

Question: please, use excel and show the formula!! EXERCISE 8: USING LOOKUP AND COUNTIF FUNCTIONS TO RANK EMPLOYEE PERFORMANCE Managers often like to rank employees performance.
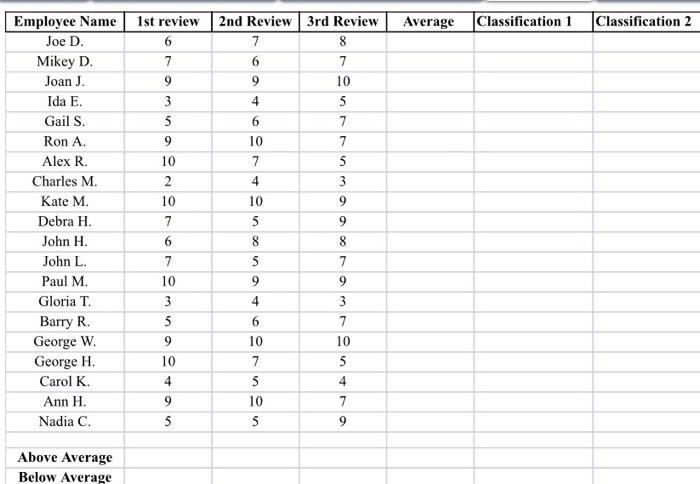
EXERCISE 8: USING "LOOKUP" AND "COUNTIF" FUNCTIONS TO RANK EMPLOYEE PERFORMANCE Managers often like to rank employees performance. One scheme called "20-70-10." or more disparagingly as "Rank and Yank," categorizes the top 20 percent of employees as "Best," the middle 70 percent of employees "Near Best," and the bottom 10 percent as "Below Best." Go to the "Excel Student Spreadsheets BUS 1011" and click on the tab/worksheet labeled "Lookup". There you will find the performance ratings--on a ten-point scale--for 20 employees. Each employee has 3 performance ratings . In the 5 Column, or Column E, calculate the average performance rating for each employee to one decimal place Then, in the 6 Column, or Column F, use the LOOKUP function below to classify the employees. LOOKUP(E2,40,4,9,10)."Below Best", "Near Best", "Best"}} The Lookup formula is structured as follows: Ez is the Cell containing the data for which the calculation should be made. . 0 to 4 is the classification of "Below Best" 4 to 9 is the classification of "Near Best". 9 to 10 is the classification of "Best" The words "Below Best", "Near Best", and "Best" are placed for each of the three classifications according to an employee's average rating Using the results, do the following: 1. List the names of the "Best" employees 2. List the names of the "Near Best" employees 3. List the names of the "Below Best" employees Next, redefine the Lookup function to classify employees as "Above Average" and "Below Average based on whether they scored above or below an average of 5 in their three performance scores. Place the results in the "Column, or Column G Next, we're going to count how many employees were categorized as either "Above Average" or "Below Average". Place the following results in cells B23 and B24. 4. How many people scored "Above Average?" 5. How many people scored "Below Average?" To answer these questions, use the COUNTIF function, its form is COUNTIF(G2:621. "Above Average), where G2 G21 is the range of cells. In this example, the function counts the number of employees that were "Above Average according to the former classification Lastly, you will notice that more people scored "Above Average" than "Below Average" using 5 as the cut point. Redefine the LOOKUP formula so that a roughly equal number of employees are classified as 'Above Average and as "Below Average. 6. What is the new cutoff point? Average Classification 1 Classification 2 Employee Name Joe D. Mikey D. Joan J. Ida E. Gail S. Ron A. Alex R Charles M. Kate M. Debra H. John H. John L. Paul M. Gloria T. Barry R. George W. George H. Carol K. Ann H. Nadia C. 1st review 6 7 9 3 5 9 10 2 10 7 6 7 10 3 5 9 10 4 9 5 2nd Review 3rd Review 7 8 6 7 9 10 4 5 6 7 10 7 7 5 4 3 10 9 5 9 8 8 5 7 9 9 4 3 6 7 10 10 7 5 5 4 10 7 5 9 non Above Average Below Average
Step by Step Solution
There are 3 Steps involved in it

Get step-by-step solutions from verified subject matter experts