

Question: Please use Excel and write down the steps in finding Refer to the Math and gender dataset. The dataset contains the mean PISA Math scores
Please use Excel and write down the steps in finding
Refer to the Math and gender dataset. The dataset contains the mean PISA Math scores for samples of 15 year old male and female students from a number of randomly selected schools in each various nations.
Perform a regression analysis using mean male score as the explanatory variable and mean female score as the response variable
(a) Scatterplot of female mean score vs male mean score, and include the regression line on the scatterplot.
(b) Interpret the slope in the context of this problem.
(c) Use the equation of least-squares regression line to predict the female mean (Math) score for Singapore
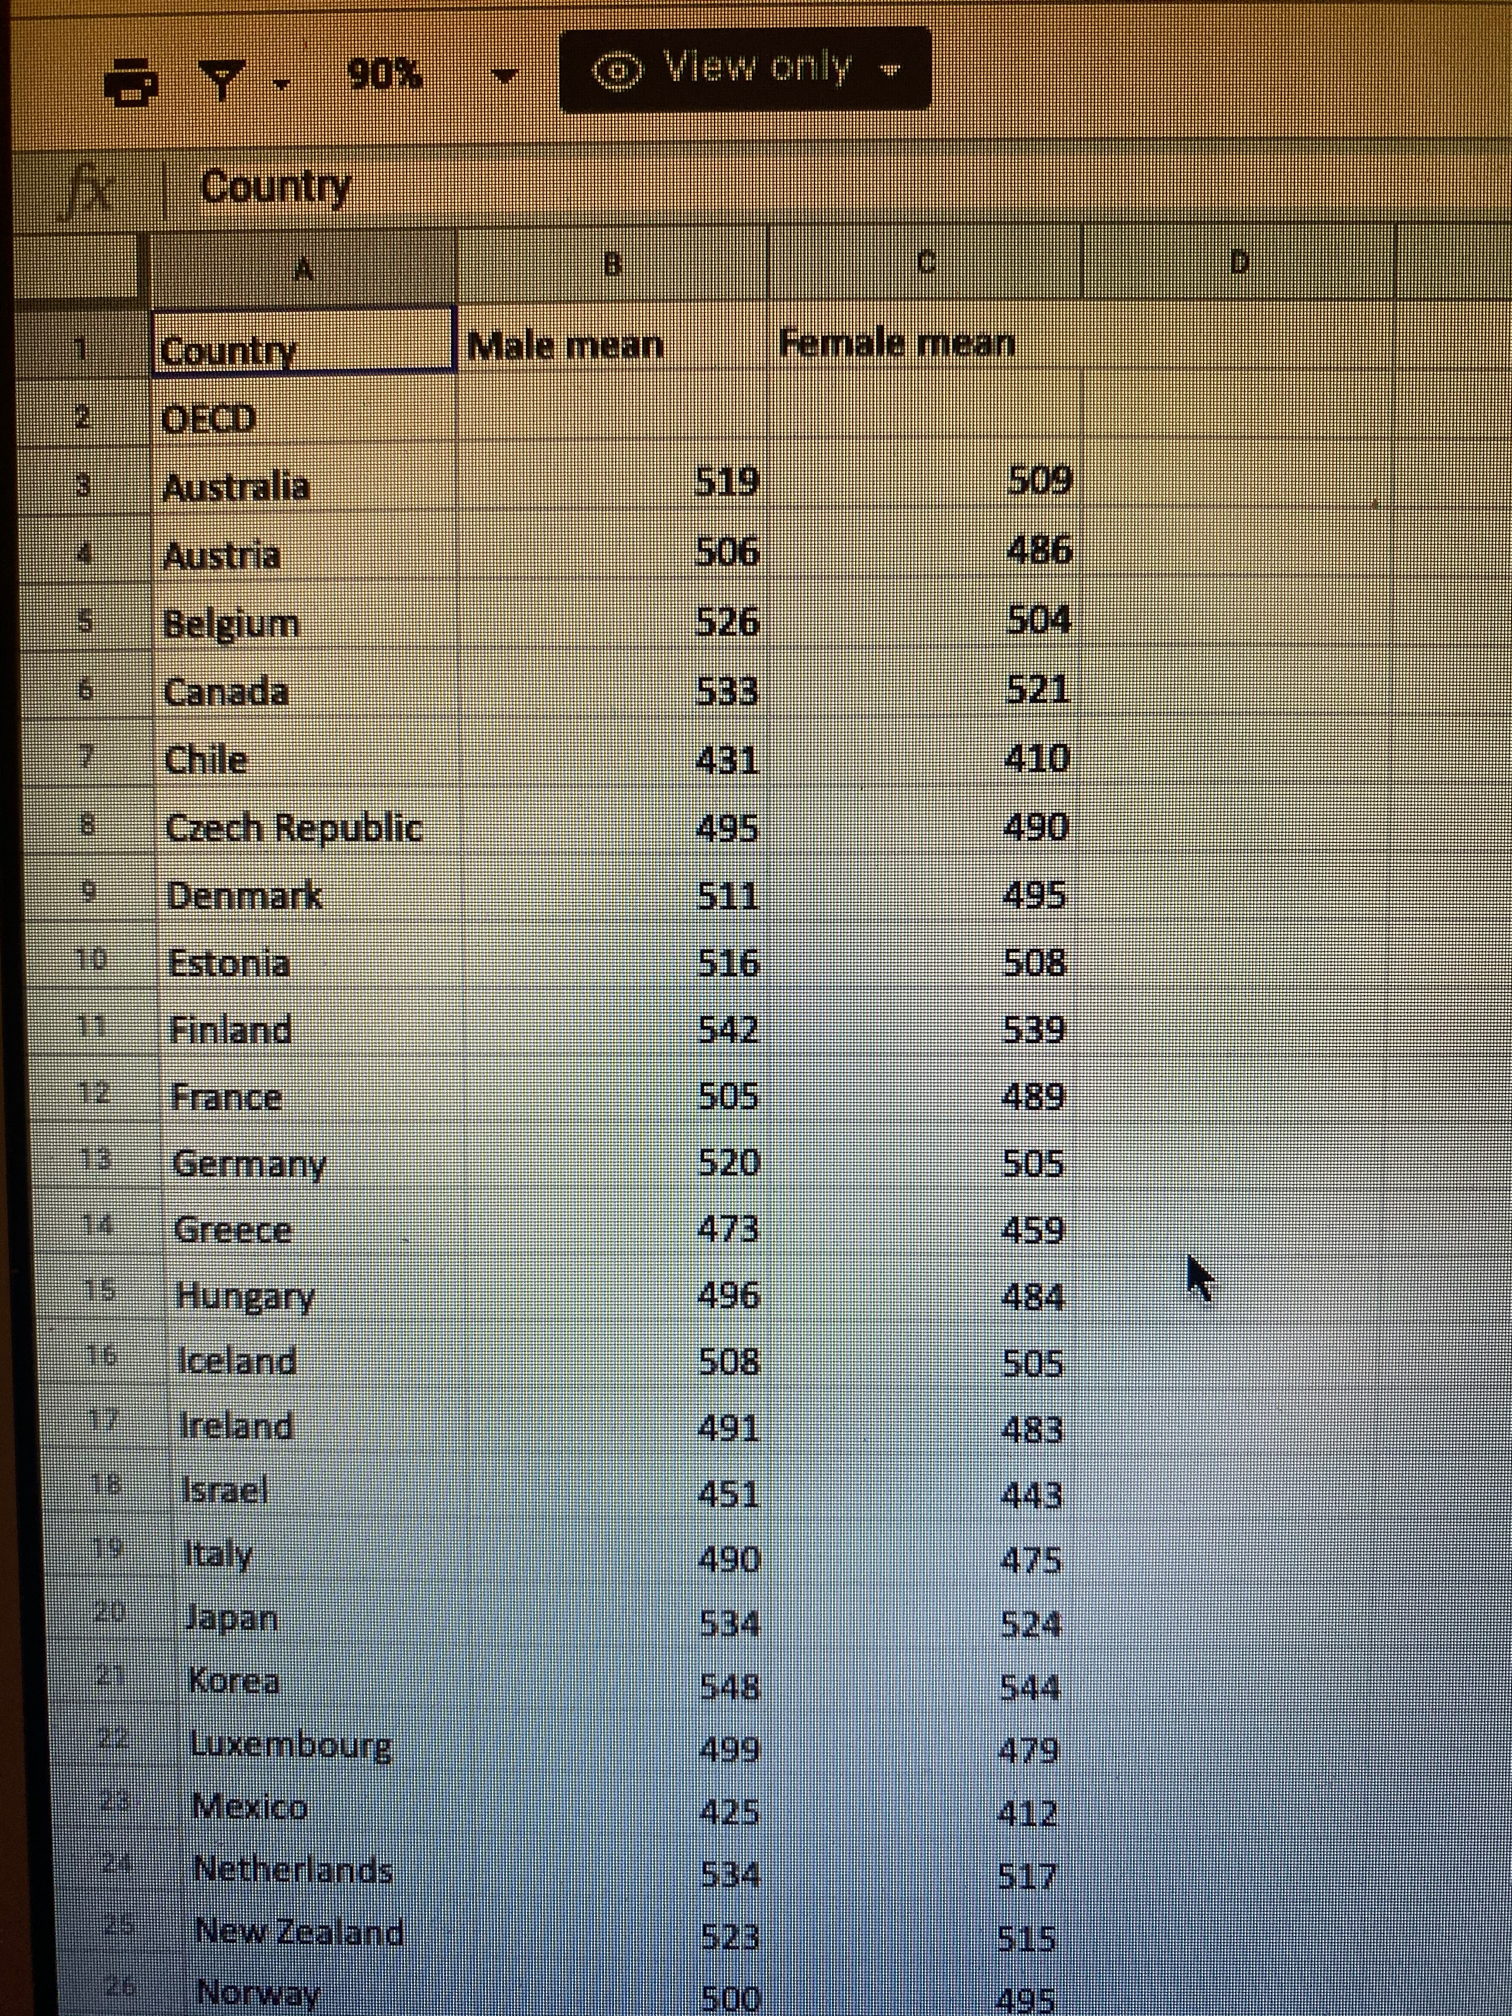

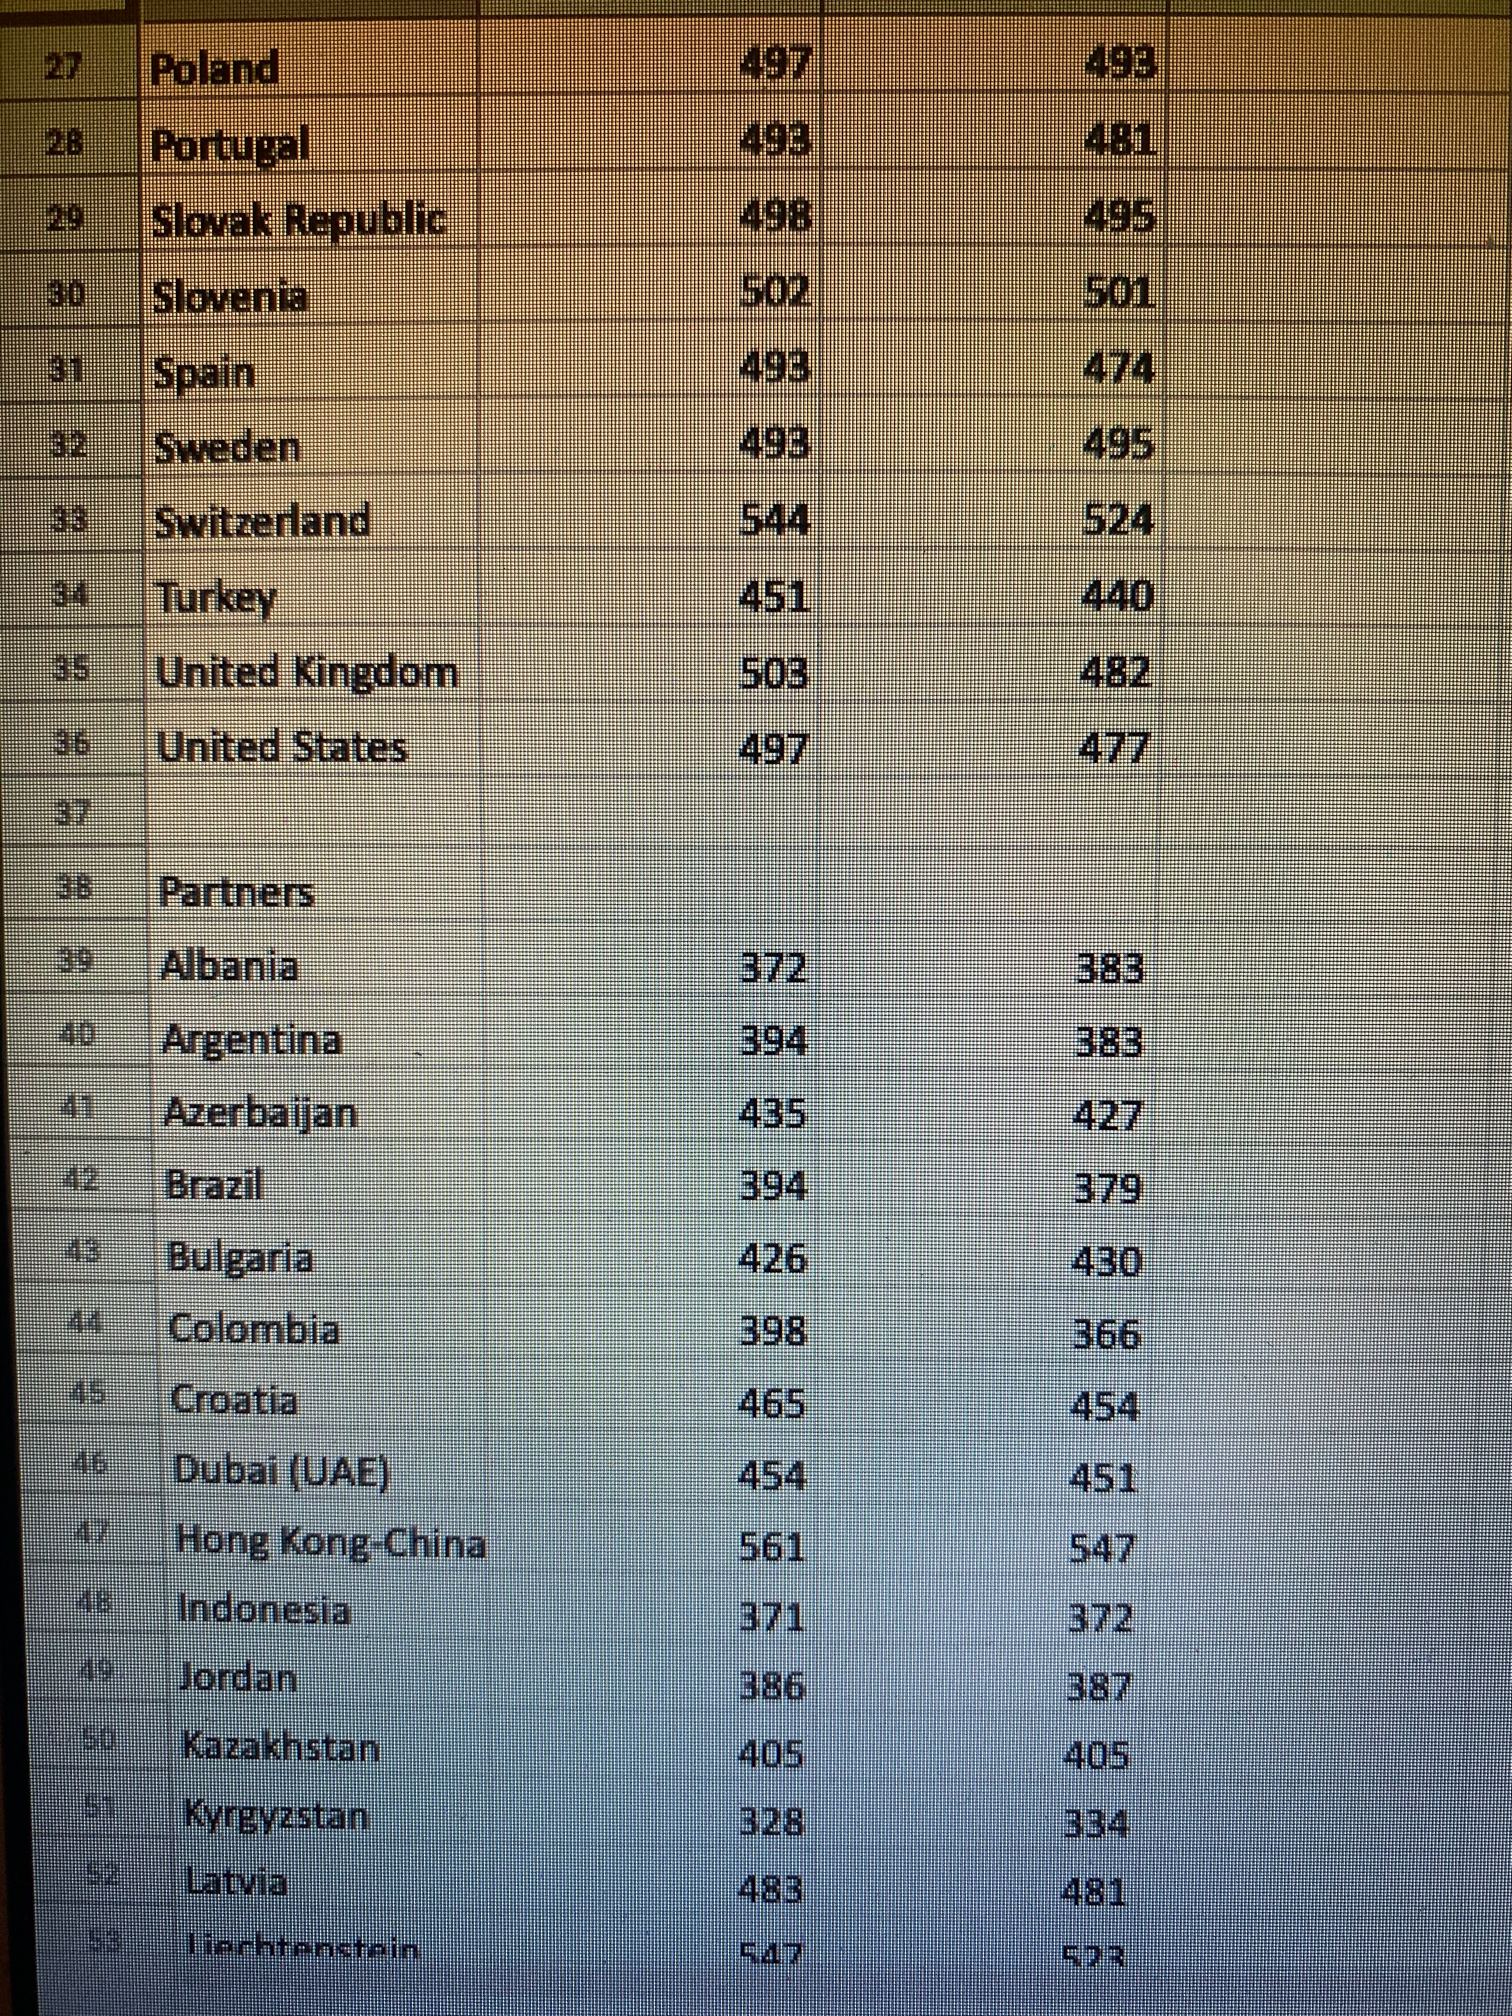
Y - 90% View only s Country Country Male mean Female mean OECD Australia 519 509 Austria 506 486 Belgium 526 504 Canada 533 521 Chile 431 410 Czech Republic 495 490 Denmark 511 495 Estonia 516 508 1 Finland 542 539 France 505 489 Germany 520 505 Greece 473 459 Hungary 496 484 Iceland 508 505 Ireland 491 483 Israel 451 443 Italy 490 475 Japan 534 524 Korea 548 544 Luxembourg 499 479 Mexico 425 412 Netherlands 534 517 New Zealand 523 515 Norway 500 495Y - 90% View only s Country Country Male mean Female mean OECD Australia 519 509 Austria 506 486 Belgium 526 504 Canada 533 521 Chile 431 410 Czech Republic 495 490 Denmark 511 495 Estonia 516 508 1 Finland 542 539 France 505 489 Germany 520 505 Greece 473 459 Hungary 496 484 Iceland 508 505 Ireland 491 483 Israel 451 443 Italy 490 475 Japan 534 524 Korea 548 544 Luxembourg 499 479 Mexico 425 412 Netherlands 534 517 New Zealand 523 515 Norway 500 495\f
Step by Step Solution
There are 3 Steps involved in it

Get step-by-step solutions from verified subject matter experts