

Question: please use excel for one and two the following table contains pricedemand and total cost data for the production of regular sleeping blankets, where the
please use excel for one and two
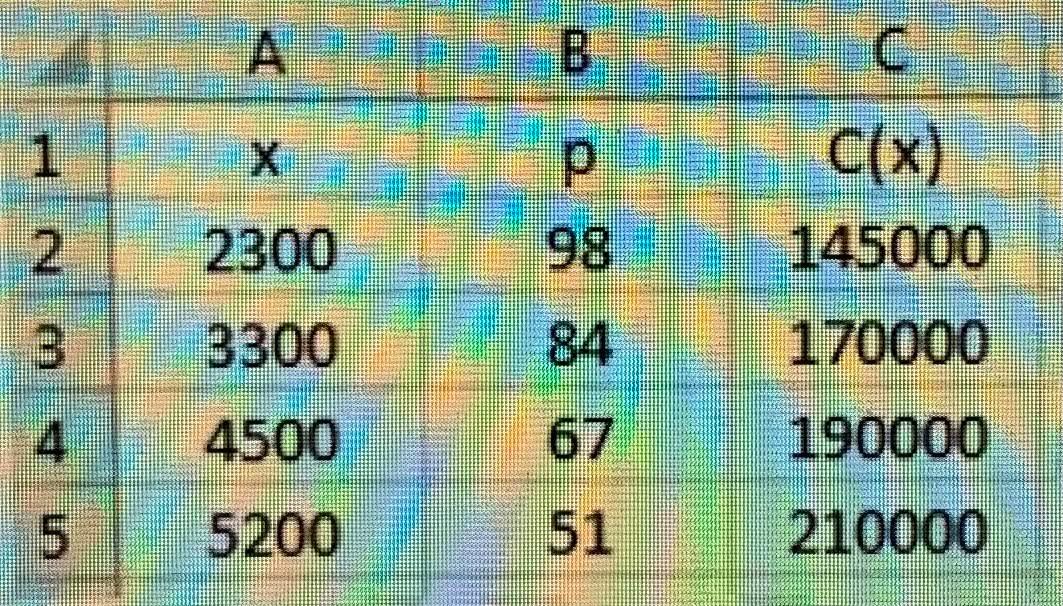
the following table contains pricedemand and total cost data for the production of regular sleeping blankets, where the wholesale price (in dollars) of a sleeping blankets is for an annual demand of sleeping blankets and is the total cost (in dollars) of producing sleeping blankets:
1) By using the pricedemand equation found in part (a), and cost function found in part (b), find the profit function, (), in terms of , and then plot its graph using Excel.
2) Verify your answer for the maximum profit and the number of sleeping blankets that leads to maximum profit you found in part (d) by using Excel Solver.
3) Find (8500) and (9500), and then interpret the result.
A 1 x 2. 2300 3 3300 98 C C(x) 145000 170000 190000 210000 84 4 4500 67 5 5200 51 A 1 x 2. 2300 3 3300 98 C C(x) 145000 170000 190000 210000 84 4 4500 67 5 5200 51
Step by Step Solution
There are 3 Steps involved in it

Get step-by-step solutions from verified subject matter experts