

Question: Please use excel for this problem and show formulas: Jim's restaurant business St fluctuates in successive years between three states: 1 (bankruptcy), 2 (verge of
Please use excel for this problem and show formulas: 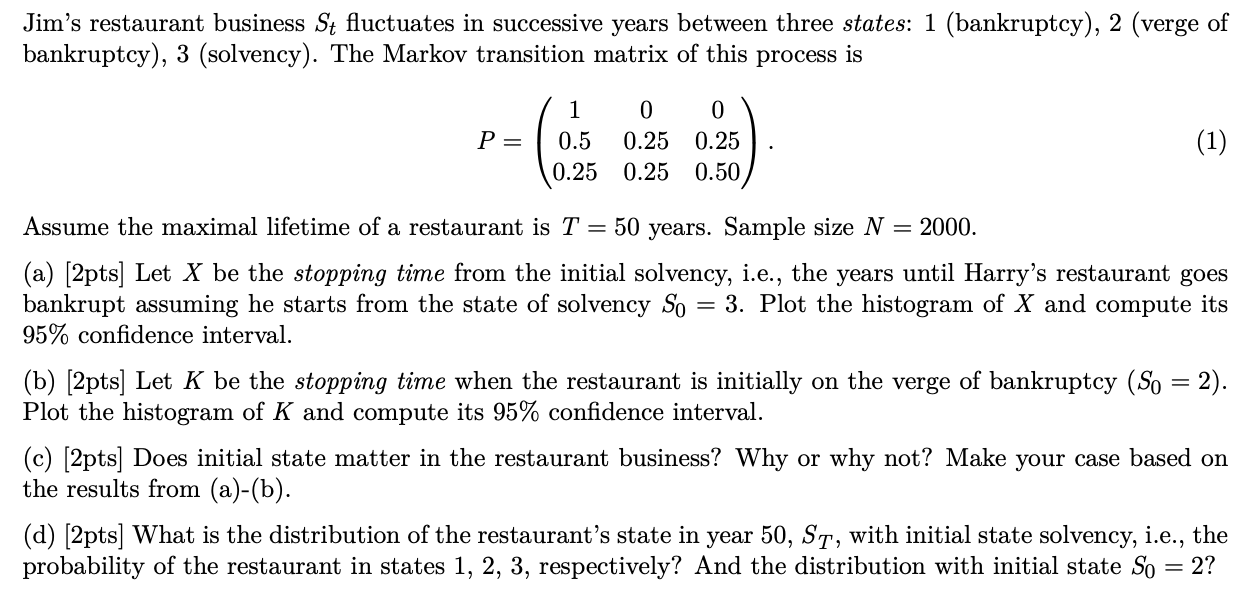
Jim's restaurant business St fluctuates in successive years between three states: 1 (bankruptcy), 2 (verge of bankruptcy), 3 (solvency). The Markov transition matrix of this process is P=10.50.2500.250.2500.250.50. Assume the maximal lifetime of a restaurant is T=50 years. Sample size N=2000. (a) [2pts] Let X be the stopping time from the initial solvency, i.e., the years until Harry's restaurant goes bankrupt assuming he starts from the state of solvency S0=3. Plot the histogram of X and compute its 95% confidence interval. (b) [2pts] Let K be the stopping time when the restaurant is initially on the verge of bankruptcy (S0=2). Plot the histogram of K and compute its 95% confidence interval. (c) [2pts] Does initial state matter in the restaurant business? Why or why not? Make your case based on the results from (a)-(b). (d) [2pts] What is the distribution of the restaurant's state in year 50,ST, with initial state solvency, i.e., the probability of the restaurant in states 1,2,3, respectively? And the distribution with initial state S0=2
Step by Step Solution
There are 3 Steps involved in it

Get step-by-step solutions from verified subject matter experts