

Question: Please use Excel formulas to find the missing yellow fields and subsequently provide a breakeven analysis. Questions are: 1. Determine Total Sales 2. Determine Total
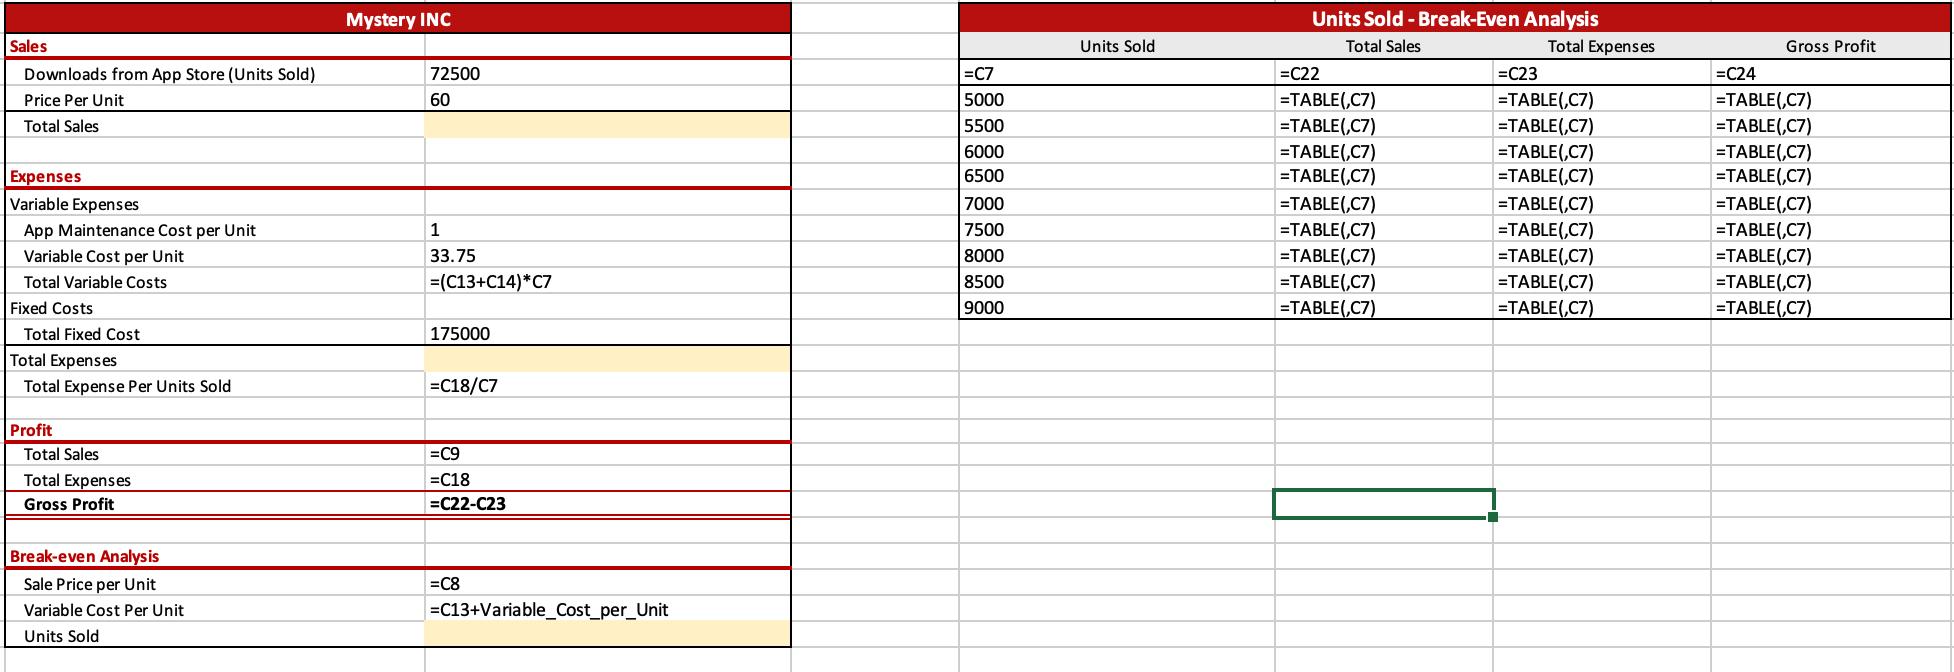
Please use Excel formulas to find the missing yellow fields and subsequently provide a breakeven analysis.
Questions are:
1. Determine Total Sales
2. Determine Total Expenses
3. For Breakeven Analysis, how many units do you approximately need to sell to break even? (C29)
HINT: Think about variable and fixed costs and how that impacts the cost of each unit sold
4. Represent your Breakeven Analysis Data on a Line Graph
HINT: Using the Break Even Analysis chart, graph both Total Sales and Total Expenses. Enter "Units Sold" on the Horizontal Axis and "Gross Profit" on the Vertical Axis
In your final report, state your findings based on the Breakeven Analysis. What does the breakeven amount tell you about profitability?
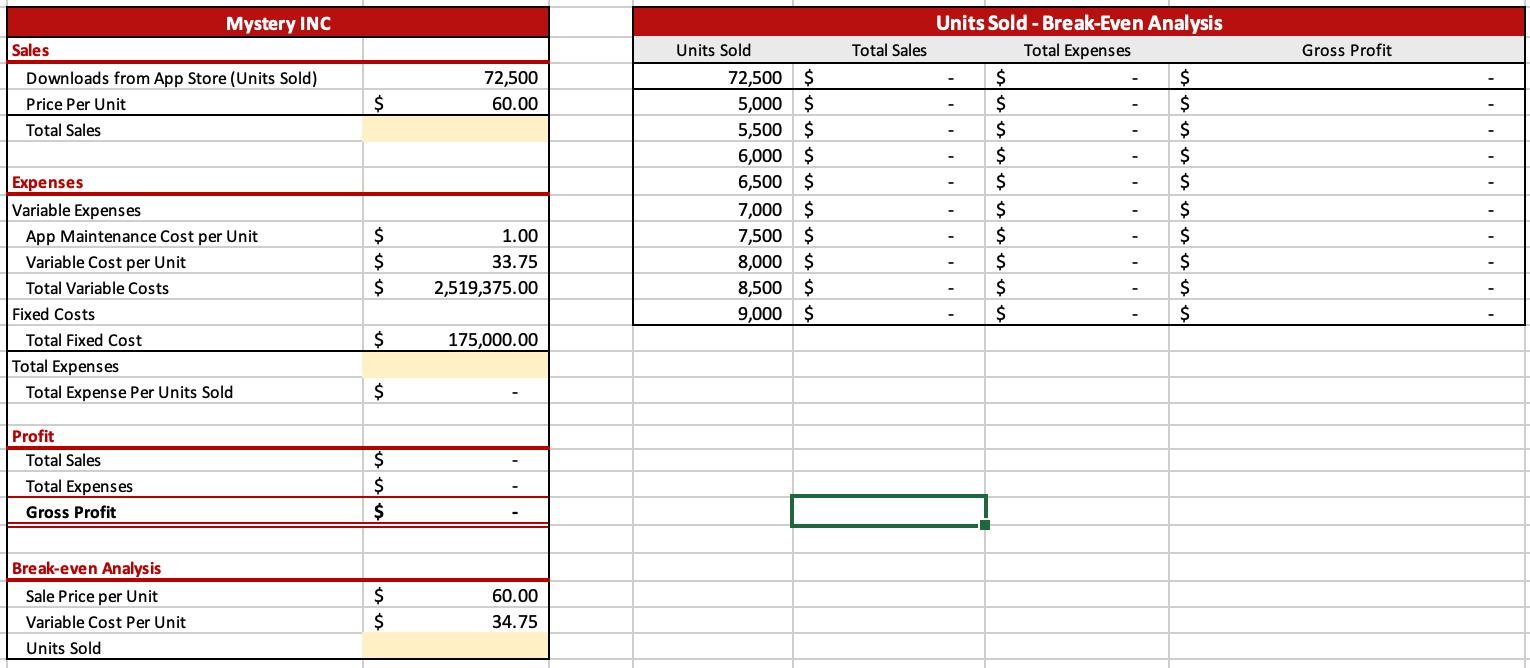
Sales Downloads from App Store (Units Sold) Price Per Unit Total Sales Expenses Variable Expenses App Maintenance Cost per Unit Variable Cost per Unit Total Variable Costs Fixed Costs Total Fixed Cost Mystery INC Total Expenses Total Expense Per Units Sold Profit Total Sales Total Expenses Gross Profit Break-even Analysis Sale Price per Unit Variable Cost Per Unit Units Sold $ $ $ $ $ $ $ $ $ $ $ 72,500 60.00 1.00 33.75 2,519,375.00 175,000.00 60.00 34.75 Units Sold 72,500 $ 5,000 $ 5,500 $ 6,000 $ 6,500 $ 7,000 $ 7,500 $ 8,000 $ 8,500 $ 9,000 $ Total Sales Units Sold - Break-Even Analysis Total Expenses - - - - - - $ $ $ $ $ $ $ $ $ $ - - $ $ $ $ $ $ $ $ $ $ Gross Profit
Step by Step Solution
There are 3 Steps involved in it
To provide the missing yellow fields and perform the breakeven analysis well assume the given data is organized in an Excel spreadsheet as follows A B ... View full answer

Get step-by-step solutions from verified subject matter experts