

Question: Please use Excel functions to do the sensitivity analysis of a . expected sales quantity in base year ( 2 0 2 0 ) on
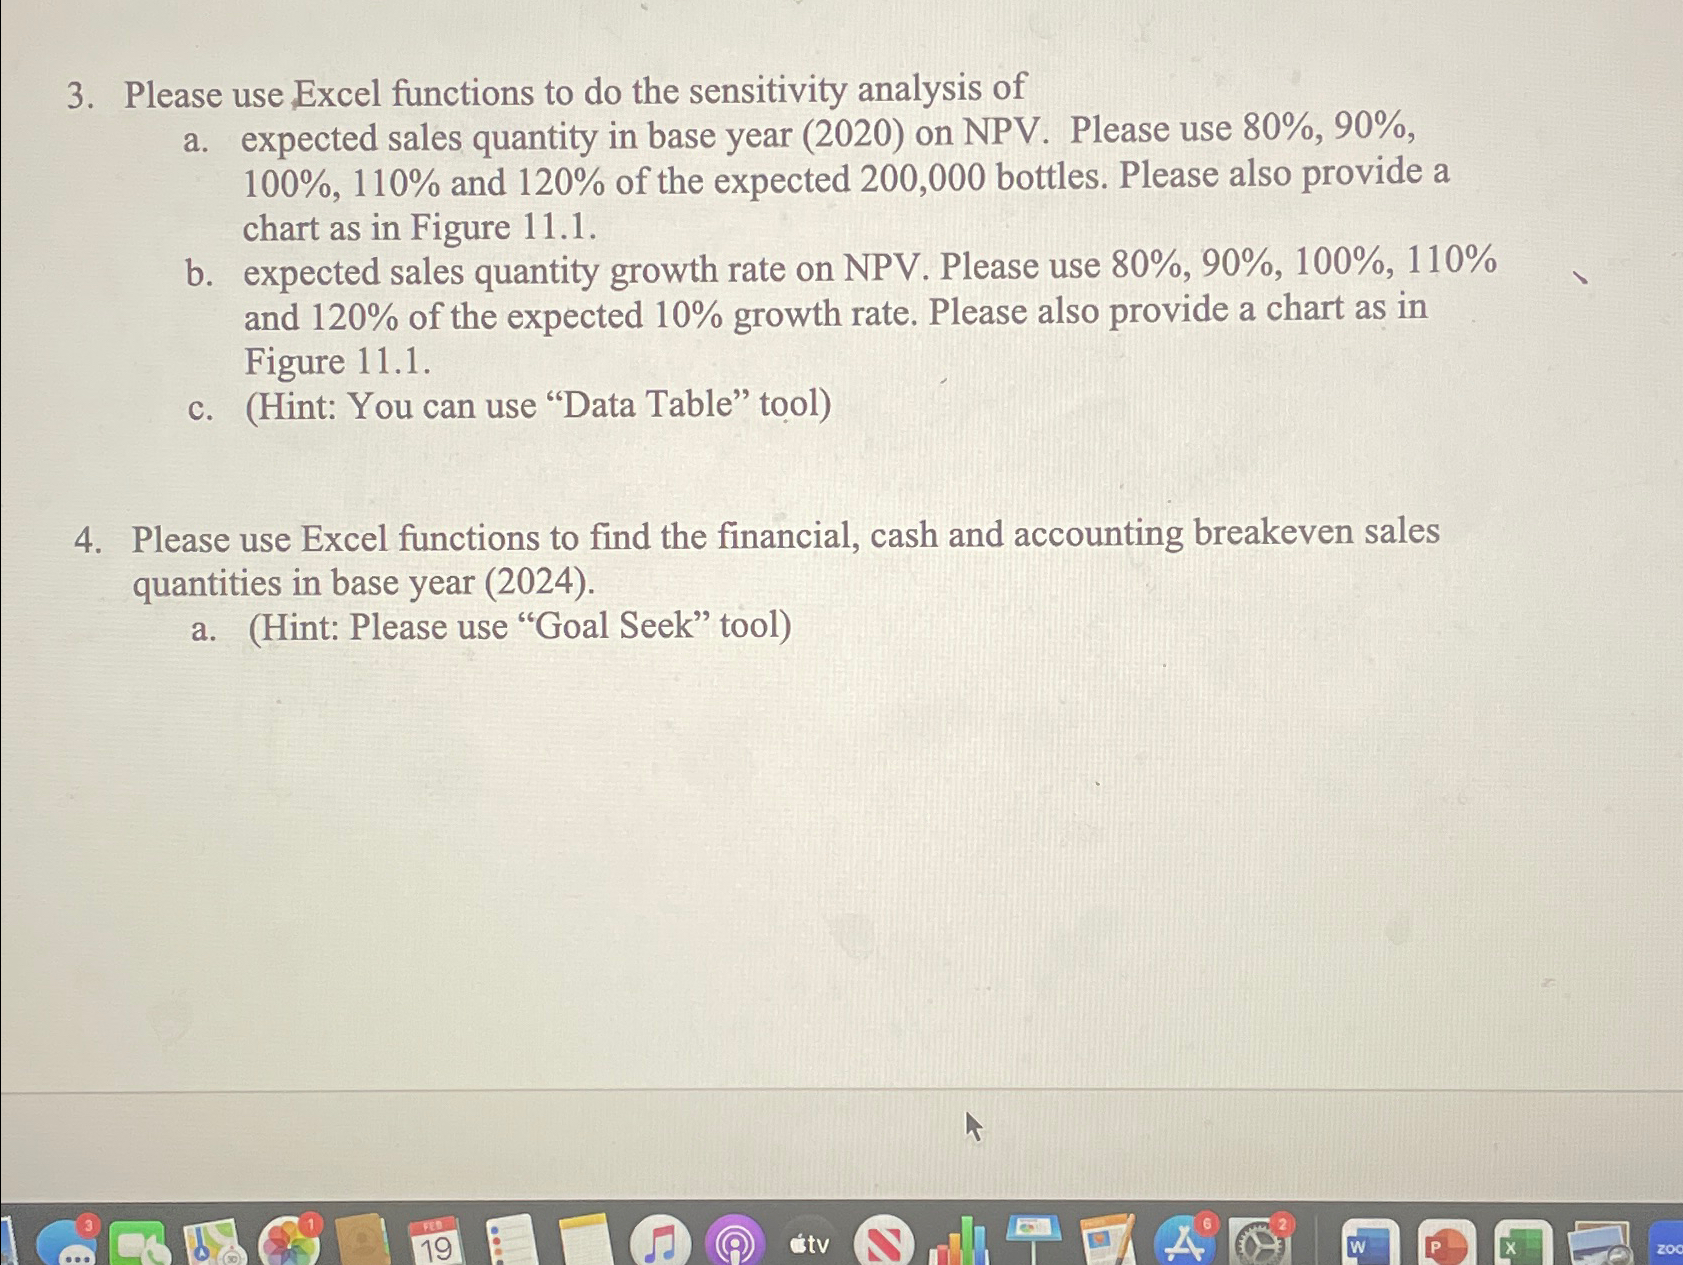
Please use Excel functions to do the sensitivity analysis of
a expected sales quantity in base year on NPV Please use and of the expected bottles. Please also provide a chart as in Figure
b expected sales quantity growth rate on NPV Please use and of the expected growth rate. Please also provide a chart as in Figure
cHint: You can use "Data Table" tool
Please use Excel functions to find the financial, cash and accounting breakeven sales quantities in base year
aHint: Please use "Goal Seek" tool
Step by Step Solution
There are 3 Steps involved in it
1 Expert Approved Answer
Step: 1 Unlock

Question Has Been Solved by an Expert!
Get step-by-step solutions from verified subject matter experts
Step: 2 Unlock
Step: 3 Unlock