

Question: Please use excel referencing and formulas. A B C D E F G H I K L M N 0 P Q R S T
Please use excel referencing and formulas.
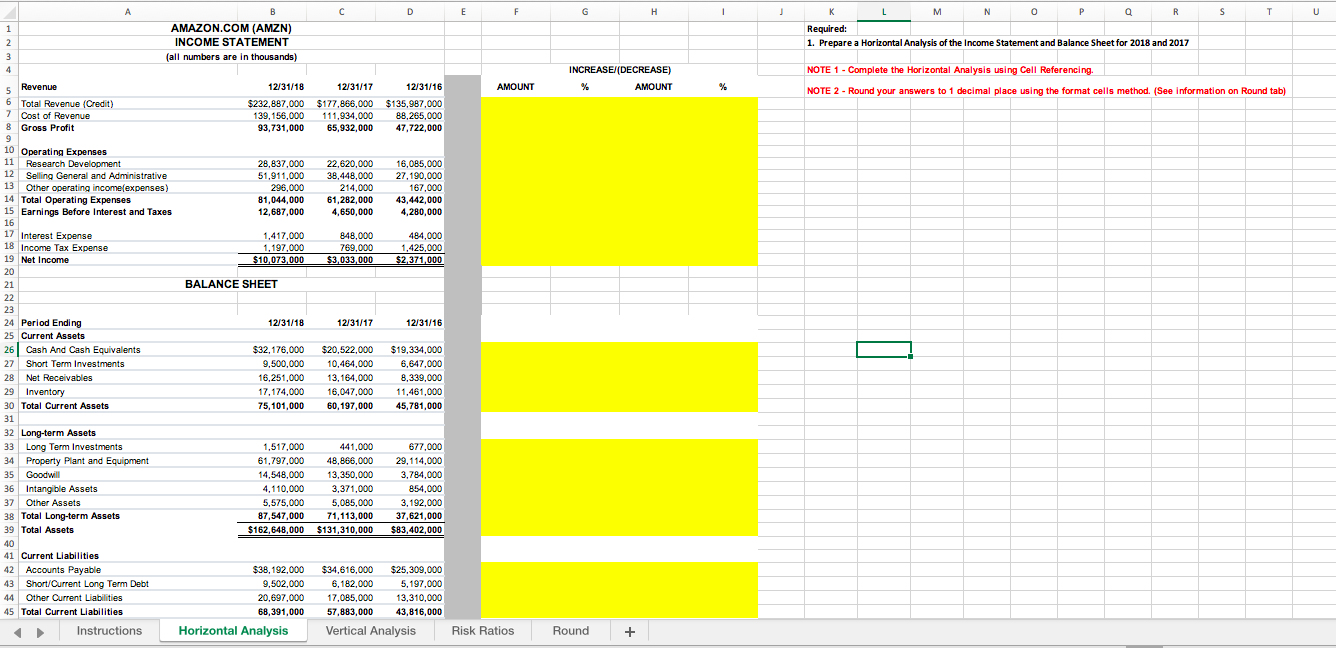
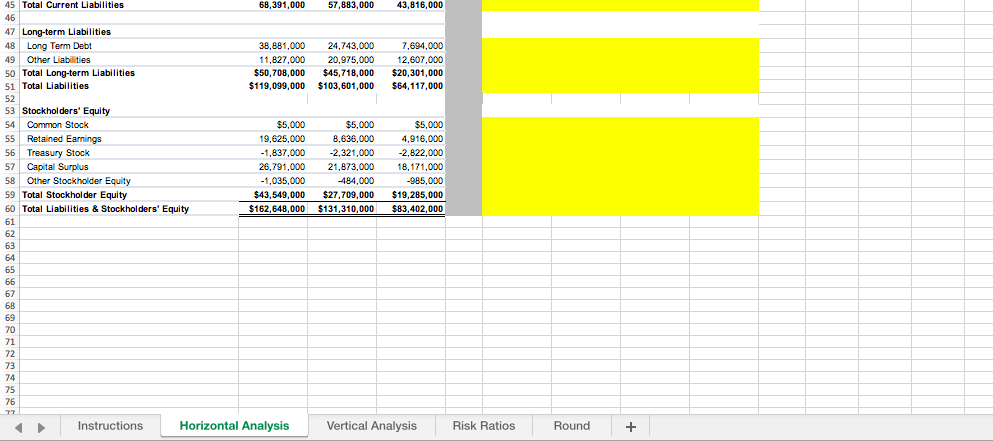
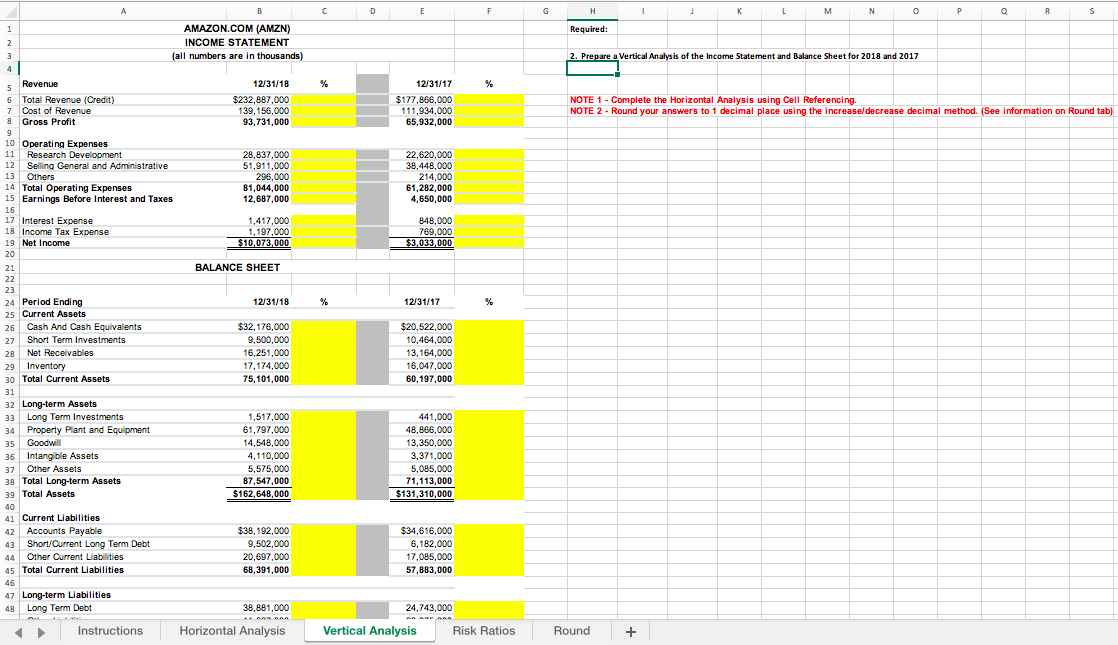
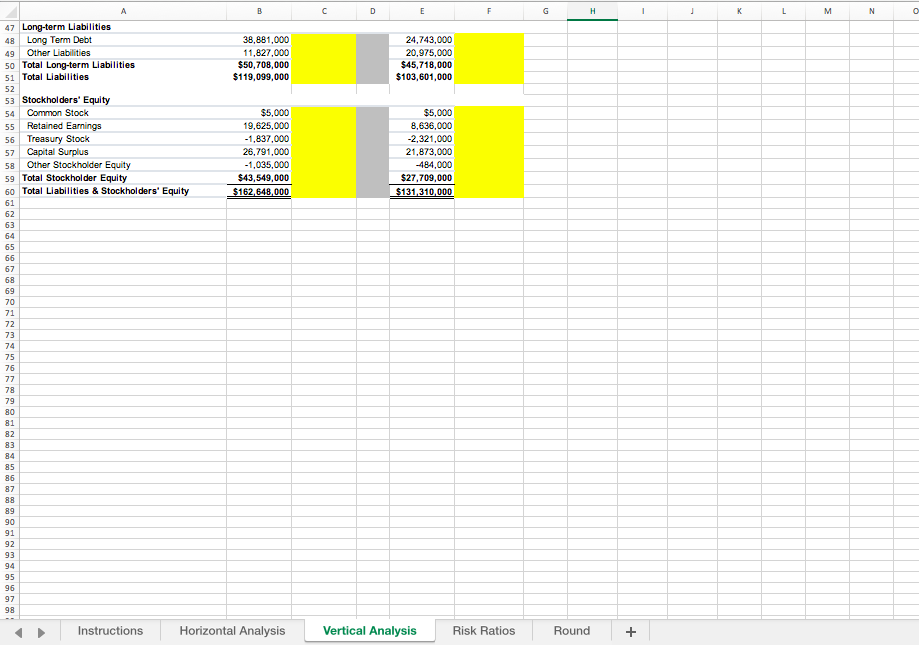
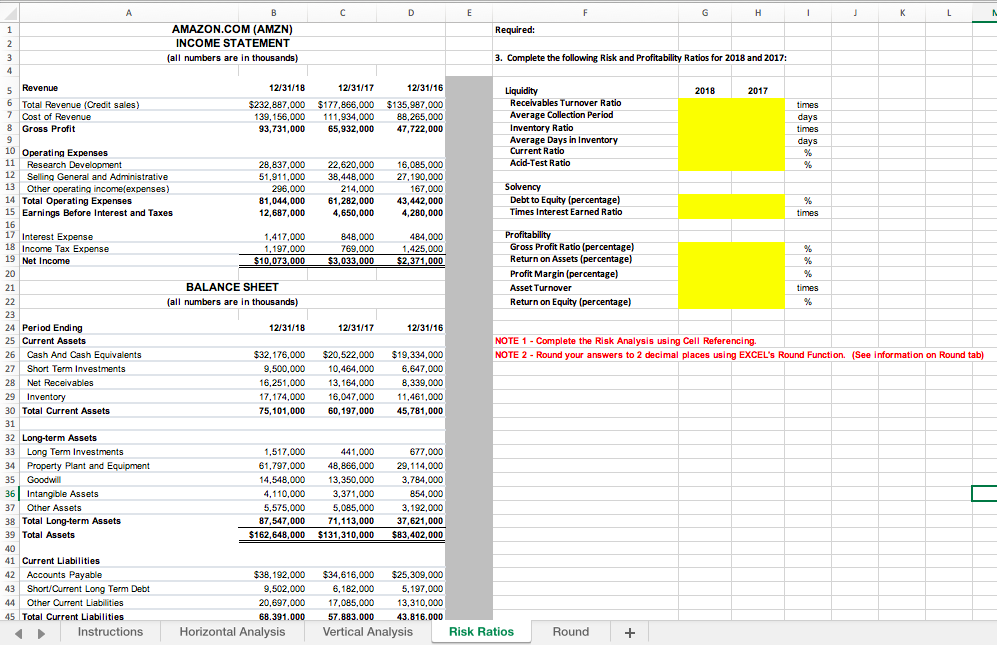
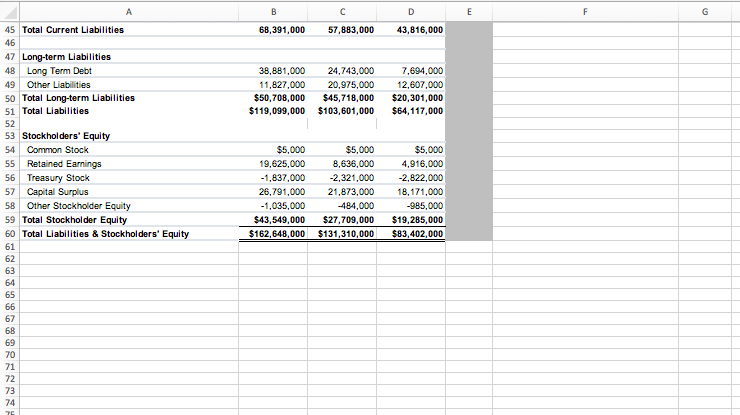
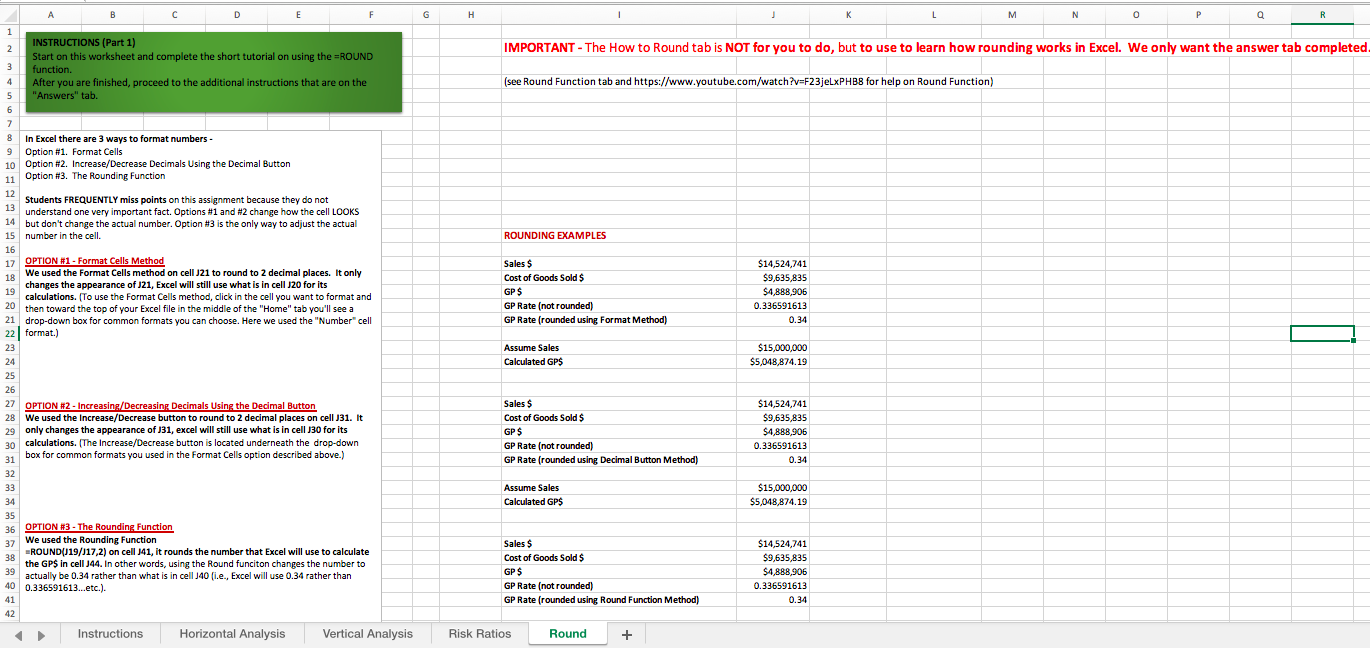
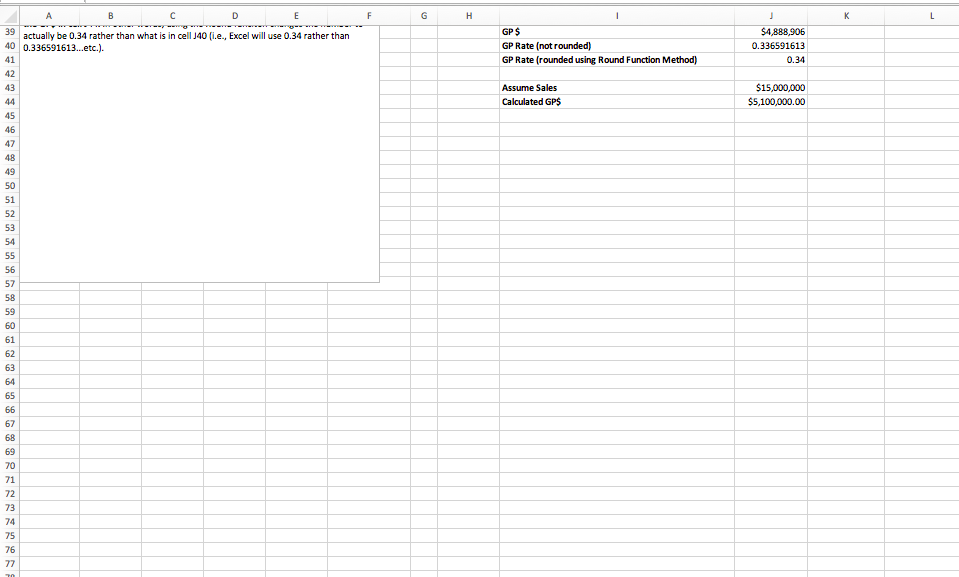
A B C D E F G H I K L M N 0 P Q R S T U AMAZON.COM (AMZN) Required: INCOME STATEMENT 1. Prepare a Horizontal Analysis of the Income Statement and Balance Sheet for 2018 and 2017 (all numbers are in thousands) INCREASE/(DECREASE) NOTE 1 - Complete the Horizontal Analysis using Cell Referencing. Revenue 12/31/18 12/31/17 12/31/16 AMOUNT % AMOUNT NOTE 2 - Round your answers to 1 decimal place using the format cells method. (See information on Round tab) Total Revenue (Credit) $232,887,000 $177,866,000 $135,987,000 Cost of Revenue 139, 156,000 111,934,000 88,265,000 8 Gross Profit 93,731,000 65,932,000 47,722,000 9 10 Operating Expenses Research Development 28,837,000 22,620,000 16,085,000 Selling General and Administrative 51,911,000 38,448,000 27, 190,000 13 Other operating income(expenses) 296,000 214,000 167,000 14 Total Operating Expenses 81,044,000 61,282,000 43,442,000 15 Earnings Before Interest and Taxes 12,687,000 4,650,000 4,280,000 16 17 Interest Expense 1,417,000 848,000 484,000 18 Income Tax Expense 1.197,000 769,000 1,425,000 19 Net Income $10,073,000 $3,033,000 $2,371,000 20 21 BALANCE SHEET 22 23 24 Period Ending 12/31/18 12/31/17 12/31/16 25 Current Assets 26 Cash And Cash Equivalents $32, 176,000 $20,522,000 $19,334,000 27 Short Term Investments 9,500,000 10,464,000 6,647,000 28 Net Receivables 16,251,000 13,164,000 8,339,000 29 Inventory 17,174,000 16,047,000 11,461,000 30 Total Current Assets 75, 101,000 60, 197,000 45,781,000 31 32 Long-term Assets 33 Long Term Investments 1,517,000 441,000 677,000 34 Property Plant and Equipment 61,797,000 48,866,000 29, 114,000 35 Goodwill 14,548,000 13,350,000 3,784,000 36 Intangible Assets 4, 110,000 3,371,000 854,000 37 Other Assets 5,575,000 5,085,000 3, 192,000 38 Total Long-term Assets 87,547,000 71, 113,000 37,621,000 39 Total Assets $162,648,000 $131,310,000 $83, 402,000 40 41 Current Liabilities Accounts Payable $38, 192,000 $34,616,000 $25,309,000 Short/Current Long Term Debt 9,502,000 6, 182,000 5, 197,000 44 Other Current Liabilities 20,697,000 17,085,000 13,310,000 45 Total Current Liabilities 68,391,000 57,883,000 43,816,000 Instructions Horizontal Analysis Vertical Analysis Risk Ratios Round +45 Total Current Liabilities 68,391,000 57,883,000 43,816,000 46 47 Long-term Liabilities 48 Long Term Debt 38,881,000 24,743,000 7,694,000 49 Other Liabilities 11,827,000 20,975,000 12,607,000 50 Total Long-term Liabilities $50,708,000 $45,718,000 $20,301,000 51 Total Liabilities $119,099,000 $103,601,000 $64, 117,000 52 Stockholders Equity 54 Common Stock $5,000 $5,000 $5,000 55 Retained Earnings 19,625,000 8,636,000 4,916,000 56 Treasury Stock -1,837,000 -2,321,000 -2,822,000 57 Capital Surplus 26,791,000 21,873,000 18, 171,000 58 Other Stockholder Equity -1,035,000 -484,000 -985,000 59 Total Stockholder Equity $43,549,000 $27,709,000 $19,285,000 60 Total Liabilities & Stockholders' Equity $162,648,000 $131,310,000 $83,402,000 61 62 63 64 65 66 67 68 69 70 71 72 73 74 75 76 TT Instructions Horizontal Analysis Vertical Analysis Risk Ratios Round +A C D E F G H K L M N 0 P Q R S AMAZON.COM (AMZN) Required: INCOME STATEMENT (all numbers are in thousands) 2. Prepare a Vertical Analysis of the Income Statement and Balance Sheet for 2018 and 2017 Revenue 12/31/18 12/31/17 Total Revenue (Credit) $232,887,000 $177,866,000 NOTE 1 - Complete the Horizontal Analysis using Cell Referencing. Cost of Revenue 139, 156,000 111,934,000 NOTE 2 - Round your answers to 1 decimal place using the increase/decrease decimal method. (See information on Round tab) 8 Gross Profit 93,731,000 65,932,000 9 10 Operating Expenses Research Development 28,837,000 22,620,000 12 Selling General and Administrative 61,911,000 38,448,000 13 Others 296,000 214,000 Total Operating Expenses 81,044,000 61,282,000 15 Earnings Before Interest and Taxes 12,687,000 4,650,000 16 17 Interest Expense 1,417,000 848,000 18 Income Tax Expense 1,197,000 769,000 19 Net Income $10.073,000 $3,033,000 20 21 BALANCE SHEET 22 23 24 Period Ending 12/31/18 12/31/17 25 Current Assets 26 Cash And Cash Equivalents $32, 176,000 $20,522,000 27 Short Term Investments 9,500,000 10,464,000 28 Net Receivables 16,251,000 13,164,000 29 Inventory 17,174,000 16,047,000 30 Total Current Assets 75, 101,000 60, 197,000 31 32 Long-term Assets 33 Long Term Investments 1,517,000 441,000 34 Property Plant and Equipment 61,797,000 48,866,000 35 Goodwill 14,548,000 13,350,000 36 Intangible Assets 4,110,000 3,371,000 37 Other Assets 5,575,000 5,085,000 38 Total Long-term Assets 87,547,000 71,113,000 39 Total Assets $162,648,000 $131,310,000 40 41 Current Liabilities 42 Accounts Payable $38, 192,000 $34,616,000 43 Short/ Current Long Term Debt 9,502,000 6, 182,000 44 Other Current Liabilities 20,697,000 17,085,000 45 Total Current Liabilities 68,391,000 57,883,000 46 47 Long-term Liabilities 48 Long Term Debt 38,881,000 24,743,000 ann Instructions Horizontal Analysis Vertical Analysis Risk Ratios Round +B C D E F G H I J K L M N 47 Long-term Liabilities 48 Long Term Debt 38,881,000 24,743,000 49 Other Liabilities 11,827,000 20,975,000 50 Total Long-term Liabilities $50,708,000 $45,718,000 51 Total Liabilities $119,099,000 $103,601,000 52 53 Stockholders Equity 54 Common Stock $5,000 $5,000 55 Retained Earnings 19,625,000 8,636,000 56 Treasury Stock -1,837,000 -2,321,000 57 Capital Surplus 26,791,000 21,873,000 58 Other Stockholder Equity -1,035,000 -484,000 59 Total Stockholder Equity $43,549,000 $27,709,000 60 Total Liabilities & Stockholders' Equity $162,648,000 $131,310,000 61 62 63 64 67 95 96 97 98 Instructions Horizontal Analysis Vertical Analysis Risk Ratios Round +A C D E G H K AMAZON.COM (AMZN) Required: INCOME STATEMENT W N (all numbers are in thousands) 3. Complete the following Risk and Profitability Ratios for 2018 and 2017: Revenue 12/31/18 12/31/17 12/31/16 Liquidity 2018 2017 Total Revenue (Credit sales) $232,887,000 $177,866,000 $135,987,000 Receivables Turnover Ratio times Cost of Revenue 139, 156,000 111,934,000 BB,265,000 Average Collection Period days Gross Profit 93,731,000 65,932,000 47,722,000 Inventory Ratio times 9 Average Days in Inventory days 10 Operating Expenses Current Ratio % 11 Research Development 28,837,000 22,620,000 16,085,000 Acid-Test Ratio 12 Selling General and Administrative 51,911,000 38, 448,000 27, 190,000 13 Other operating income(expenses) 296,000 214,000 167,000 Solvency 14 Total Operating Expenses 81,044,000 61,282,000 13,442,000 Debt to Equity (percentage) % 15 Earnings Before Interest and Taxes 12,687,000 4,650,000 4,280,000 Times Interest Earned Ratio times 16 17 Interest Expense 1,417,000 848,000 484,000 Profitability 18 Income Tax Expense 1,197,000 769,000 1,425,000 Gross Profit Ratio (percentage) 19 Net Income $10,073,000 $3,033,000 $2,371,000 Return on Assets (percentage) 20 Profit Margin (percentage) 21 BALANCE SHEET Asset Turnover time 22 (all numbers are In thousands) Return on Equity (percentage) 23 24 Period Ending 12/31/18 12/31/17 12/31/16 25 Current Assets NOTE 1 - Complete the Risk Analysis using Cell Referencing. 26 Cash And Cash Equivalents $32, 176,000 $20,522,000 $19,334,000 NOTE 2 - Round your answers to 2 decimal places using EXCEL's Round Function. (See Information on Round tab) Short Term Investments 9,500,000 10,464,000 6,647,000 28 Net Receivables 16,251,000 13, 164,000 8,339,000 29 Inventory 17.174,000 16,047,000 11,461,000 30 Total Current Assets 75, 101,000 60, 197,000 45,781,000 31 32 Long-term Assets Long Term Investments 1,517,000 441,000 677,000 34 Property Plant and Equipment 61,797,000 48,866,000 29, 114,000 35 Goodwill 14.548,000 13,350,000 3,784,000 36 Intangible Assets 4,110,000 3,371,000 854,000 37 Other Asset: 5,575,000 5,085,000 3, 192,000 38 Total Long-term Assets 87,547,000 71, 113,000 37,621,000 39 Total Assets $162,648,000 $131,310,000 $83,402,000 40 41 Current Liabilities 42 Accounts Payable $38, 192,000 $34,616,000 $25,309,000 43 Short/Current Long Term Debt 9,502,000 6,182,000 5, 197,000 44 Other Current Liabilities 20,697,000 17,085,000 13,310,000 45 Total Current Liabilities 68.391.000 57.883.000 43.816.000 Instructions Horizontal Analysis Vertical Analysis Risk Ratios Round +A B C D E G 45 Total Current Liabilities 68,391,000 57,883,000 43,816,000 46 47 Long-term Liabilities 18 Long Term Debt 38,881,000 24,743,000 7.694,000 19 Other Liabilities 11,827,000 20,975,000 12,607,000 Total Long-term Liabilities $50,708,000 $45,718,000 $20,301,000 51 Total Liabilities $119,099,000 $103,601,000 $64,117,000 52 53 Stockholders Equity 51 Common Stock $5,000 $5,000 $5,000 55 Retained Earnings 19,625,000 8,636,000 4,916,000 56 Treasury Stock -1,837,000 -2,321,000 -2,822,000 57 Capital Surplus 26,791,000 21,873,000 18, 171,000 58 Other Stockholder Equity -1,035,000 -484,000 -985,000 59 Total Stockholder Equity $43,549,000 $27,709,000 $19,285,000 60 Total Liabilities & Stockholders Equity $162,648,000 $131,310,000 $83, 402,000 61 62 63 64 65 66 68 70 71 72 73 74A B C D E F G H K M N 0 Q R INSTRUCTIONS (Part 1) IMPORTANT - The How to Round tab is NOT for you to do, but to use to learn how rounding works in Excel. We only want the answer tab completed W N Start on this worksheet and complete the short tutorial on using the =ROUND function. After you are finished, proceed to the additional instructions that are on the (see Round Function tab and https://www.youtube.com/watch?v=F23jelxPHBS for help on Round Function) "Answers" tab. In Excel there are 3 ways to format numbers - Option #1. Format Cells Option #2. Increase/ Decrease Decimals Using the Decimal Button Option #3. The Rounding Function 13 Students FREQUENTLY miss points on this assignment because they do not understand one very important fact. Options #1 and #2 change how the cell LOOKS 14 but don't change the actual number. Option #3 is the only way to adjust the actual 15 number in the cell. ROUNDING EXAMPLES 16 OPTION #1 - Format Cells Method Sales $ $14,524,741 18 We used the Format Cells method on cell J21 to round to 2 decimal places. It only Cost of Goods Sold $ $9,635,835 19 changes the appearance of J21, Excel will still use what is in cell 120 for its calculations. [To use the Format Cells method, click in the cell you want to format and GP S $4,888,906 20 then toward the top of your Excel file in the middle of the "Home" tab you'll see a GP Rate (not rounded) 0.336591613 21 drop-down box for common formats you can choose. Here we used the "Number" cell GP Rate (rounded using Format Method) 0.34 22 format.) 23 Assume Sales $15,000,000 24 Calculated GPS $5,048,874.19 25 26 OPTION #2 - Increasing/Decreasing Decimals Using the Decimal Button Sales $ $14,524,741 28 We used the Increase/ Decrease button to round to 2 decimal places on cell J31. It Cost of Goods Sold $ $9,635,835 29 only changes the appearance of J31, excel will still use what is in cell 130 for its GP S $4,888,906 30 calculations. [The Increase/Decrease button is located underneath the drop-down GP Rate (not rounded) 0.336591613 31 box for common formats you used in the Format Cells option described above.) GP Rate (rounded using Decimal Button Method) 0.34 32 33 Assume Sales $15,000,000 34 Calculated GPS $5,048,874.19 35 36 OPTION #3 - The Rounding Function We used the Rounding Function Sales $ $14,524,741 38 =ROUND(J19/117,2) on cell J41, it rounds the number that Excel will use to calculate the GPS in cell J44. In other words, using the Round funciton changes the number to Cost of Goods Sold $ 59,635,835 39 actually be 0.34 rather than what is in cell J40 (i.e., Excel will use 0.34 rather than GPS $4,888,906 40 0.336591613...etc.). GP Rate (not rounded) 0.336591613 41 GP Rate (rounded using Round Function Method) 0.34 Instructions Horizontal Analysis Vertical Analysis Risk Ratios Round +B C D E F G H K L 39 actually be 0.34 rather than what is in cell 140 (i.e., Excel will use 0.34 rather than GP S 54,888,906 40 0.336591613...etc.). GP Rate (not rounded) 0.336591613 41 GP Rate (rounded using Round Function Method) 0.34 42 43 Assume Sales $15,000,000 44 Calculated GPS $5,100,000.00 45 46 37
Step by Step Solution
There are 3 Steps involved in it

Get step-by-step solutions from verified subject matter experts