

Question: please use excel sheets and provide formulas for this, thank you Duntilington has tracked datiy sales of costs for the three locations below. Question Set
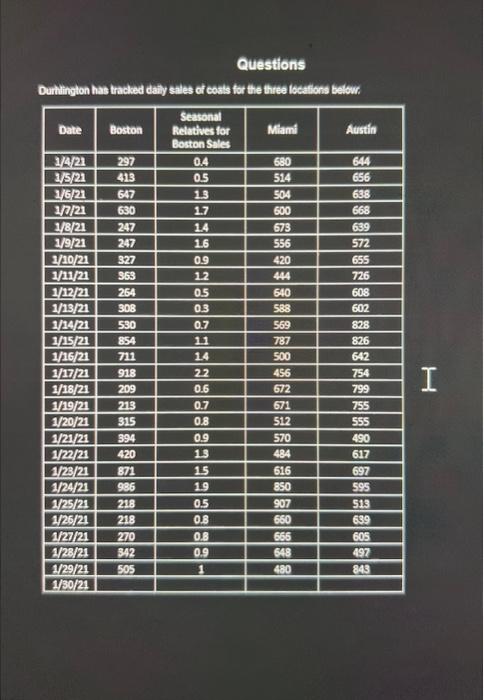
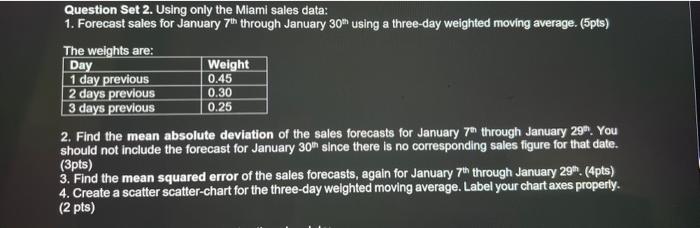
Duntilington has tracked datiy sales of costs for the three locations below. Question Set 2. Using only the Miami sales data: 1. Forecast sales for January 7th through January 30m using a three-day weighted moving average. (5pts) The weiohts are: 2. Find the mean absolute deviation of the sales forecasts for January 7t through January 299. You should not include the forecast for January 30th since there is no corresponding sales figure for that date. (3pts) 3. Find the mean squared error of the sales forecasts, again for January 7th through January 29th. (4pts) 4. Create a scatter scatter-chart for the three-day weighted moving average. Label your chart axes properly. (2 pts)
Step by Step Solution
There are 3 Steps involved in it

Get step-by-step solutions from verified subject matter experts