

Question: Please use Excel to construct the plots and perform your computations You work as a broker for a US company that imports European foods into
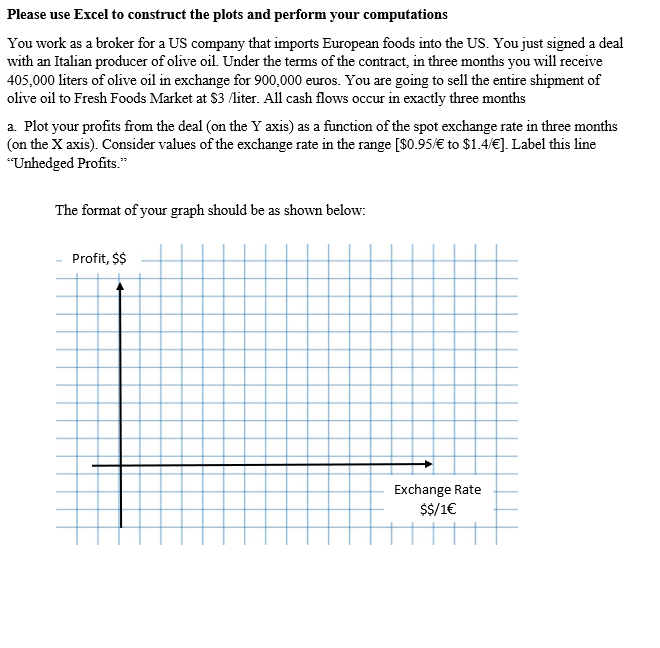
Please use Excel to construct the plots and perform your computations You work as a broker for a US company that imports European foods into the US. You just signed a deal with an Italian producer of olive oil. Under the terms of the contract, in three months you will receive 405,000 liters of olive oil in exchange for 900,000 euros. You are going to sell the entire shipment of olive oil to Fresh Foods Market at \$3 /iter. All cash flows occur in exactly three months a. Plot your profits from the deal (on the Y axis) as a function of the spot exchange rate in three months (on the X axis). Consider values of the exchange rate in the range [$0.95/ to $1.4/]. Label this line "Unhedged Profits." The format of your graph should be as shown below
Step by Step Solution
There are 3 Steps involved in it

Get step-by-step solutions from verified subject matter experts