

Question: Please use excel to solve and show the excel formulas so I can understand. Please include the rows and columns in your picture so I
 Please use excel to solve and show the excel formulas so I can understand. Please include the rows and columns in your picture so I can follow along. I'll make sure to thumbs up. I've started this problem but I cannot figure out the formulas to complete the rest. Please help, thank you!
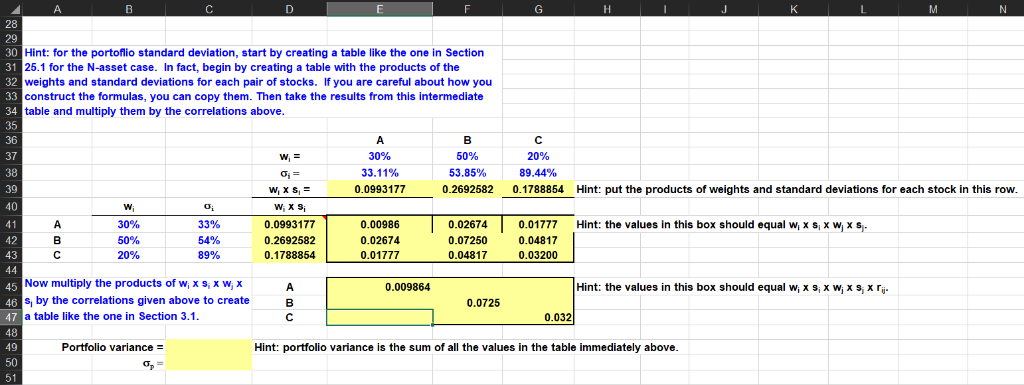
28 Hint: for the portofio standard deviation, start by creating a table like the one in Section 25.1 for the N-asset case. In fact, begin by creating a table with the products of the weights and standard deviations for each pair of stocks. If you are careful about how you 3construct the formulas, you can copy them. Then take the results from this intermediate table and multiply them by the correlations above 37 50% 53.85% 0.2692582 20% 89.44% 0.1788854 W, 33.11% 0.0993177 Hint: put the products of weights and standard deviations for each stock in this row 30% 33% 54% 89% 0.0993177 0.2692582 0.1788854 0.00986 0.02674 0.01777 0.026740.01777 Hint: the values in this box should equal WxSxWx 0.07250 0.04817 0.04817 0.03200 43 Now multiply the products of w, x s, x w s, by the correlations given above to create a table like the one in Section 3.1 45 0.009864 Hint: the values in this box should equal w x s, x w, xs, xr. 0.0725 0.032 49 Portfolio variance Hint: portfolio variance is the sum of all the values in the table immediately above
Step by Step Solution
There are 3 Steps involved in it

Get step-by-step solutions from verified subject matter experts