

Question: *Please Use Excel to solve and show work* Explain and show on a diagram the profit at maturity from the following combinations of positions. Please
*Please Use Excel to solve and show work*
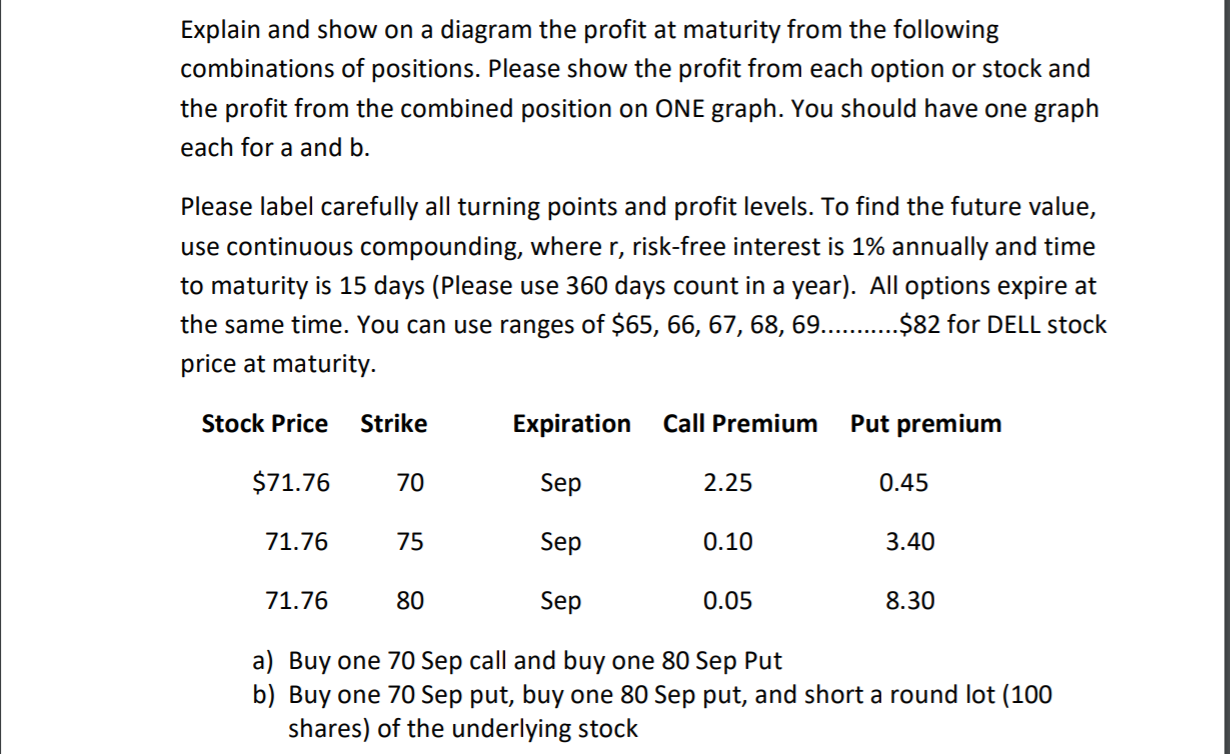
Explain and show on a diagram the profit at maturity from the following combinations of positions. Please show the profit from each option or stock and the profit from the combined position on ONE graph. You should have one graph each for a and b. Please label carefully all turning points and profit levels. To find the future value, use continuous compounding, where r, risk-free interest is 1% annually and time to maturity is 15 days (Please use 360 days count in a year). All options expire at the same time. You can use ranges of $65, 66, 67, 68, 69...... $82 for DELL stock price at maturity. Stock Price Strike Expiration Call Premium Put premium $71.76 70 Sep 2.25 0.45 71.76 75 Sep 0.10 3.40 71.76 80 Sep 0.05 8.30 a) Buy one 70 Sep call and buy one 80 Sep Put b) Buy one 70 Sep put, buy one 80 Sep put, and short a round lot (100 shares) of the underlying stock
Step by Step Solution
There are 3 Steps involved in it

Get step-by-step solutions from verified subject matter experts