

Question: Please use excel to solve this and show formulas and charts! In this problem, we assume that you are measuring the weight of an item
Please use excel to solve this and show formulas and charts!
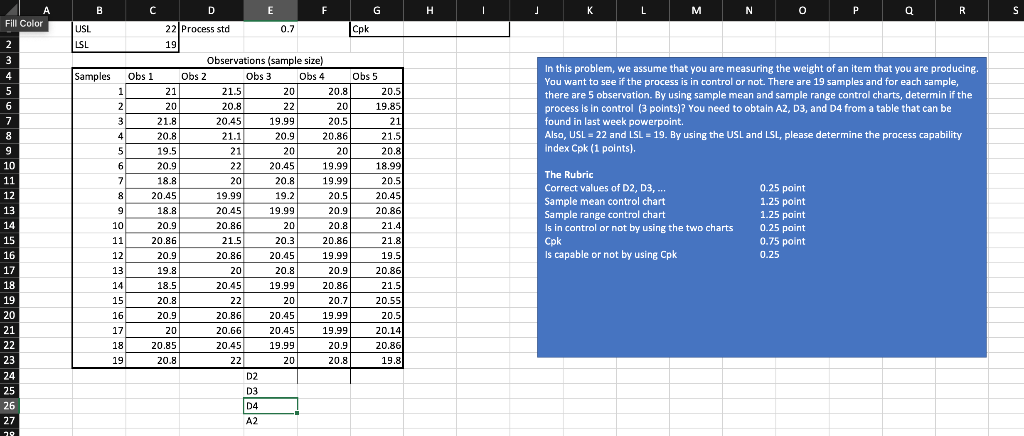
In this problem, we assume that you are measuring the weight of an item that you are producing. You want to see if the process is in control or not. There are 19 samples and for each sample, there are 5 observation. By using sample mean and sample range control charts, determin if the process is in control ( 3 points)? You need to obtain A2,D3, and D4 from a table that can be found in last week powerpoint. Also, USL = 22 and LSL = 19. By using the USL and LSL, please determine the process capability Index Cpk (1 points)
Step by Step Solution
There are 3 Steps involved in it
1 Expert Approved Answer
Step: 1 Unlock

Question Has Been Solved by an Expert!
Get step-by-step solutions from verified subject matter experts
Step: 2 Unlock
Step: 3 Unlock