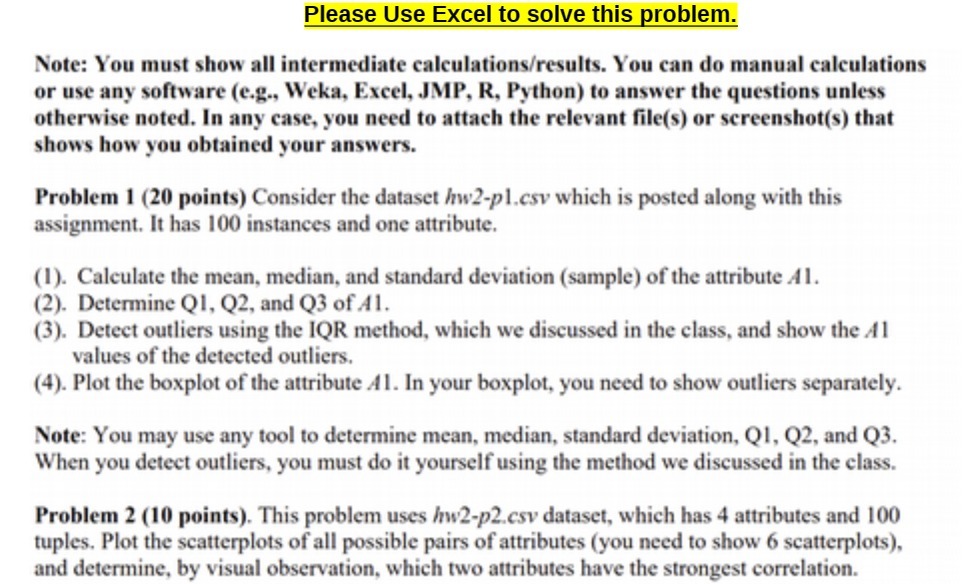
Question: Please Use Excel to solve this Emblem. Note: You must show all Intermediate calculationsimults. You can do manual calculations or use any software (e.g.. Welta.

Please Use Excel to solve this Emblem. Note: You
Please Use Excel to solve this Emblem. Note: You must show all Intermediate calculationsimults. You can do manual calculations or use any software (e.g.. Welta. Excel. .IMP. R. Python) to answer the questions unless otherwise noted. In any case. you need to attach the relevant filels) or sereenshotls) that shows how you obtained your answers. Problem I (20 points] Consider the dataset had-pl .csv which is posted along with this assignment. It has lt] instances and one attribute. (ll. Calculate the mean. median. and standard deviation (sample) of the attribute A I. {2]- Determine Ol. 02. and 03 ofxll. {3). Detect outliers using the [QR method. which we discussed in the class. and show the Al values of the detected outliers. {4]. Plot the bosplot of the attribute .41. In your bosplot. you need to show outliers separately. Note: You may use any tool to determine mean. median. standard deviation, 0!. 02. and 03. When you detect outliers. you must do it yourself using the method we discussed in the class. Problem 2 (Ill points). This problem uses hu'Z-plcsv dataset. which has 4 attributes and 100 tuples. Plot the seatterplots of all possible pairs of attributes (you need to show 6 seatterplotsl. and determine. by visual observation. which two attributes have the strongest correlation

Step by Step Solution

There are 3 Steps involved in it

1 Expert Approved Answer
Step: 1 Unlock blur-text-image
Question Has Been Solved by an Expert!

Get step-by-step solutions from verified subject matter experts

Step: 2 Unlock
Step: 3 Unlock

Students Have Also Explored These Related Accounting Questions!