

Question: please use excell slover and please clearly display all formulaes and solution 3. Refueling Airplanes Alpha Airlines wants to optimize its purchase of jet fuel
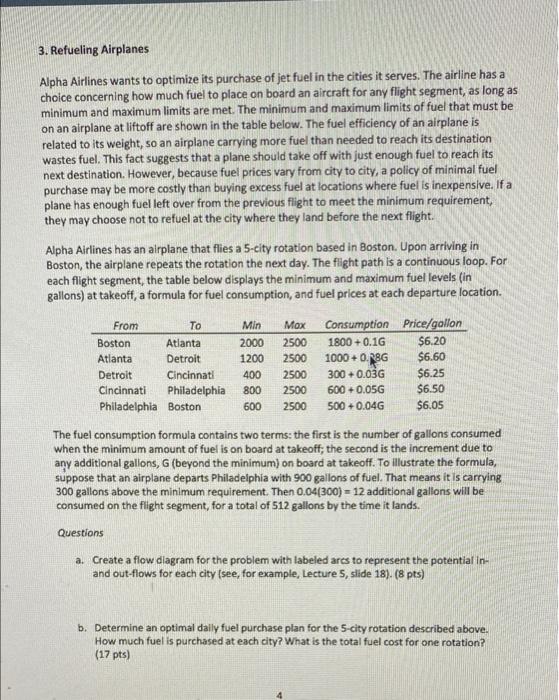
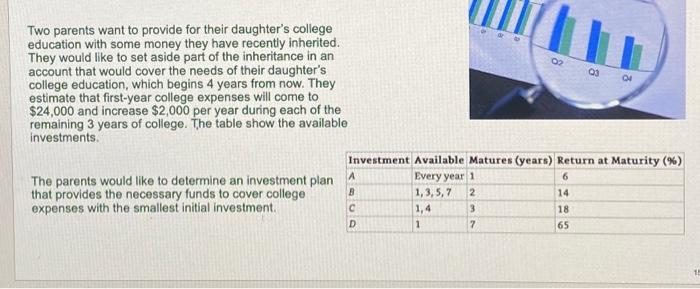
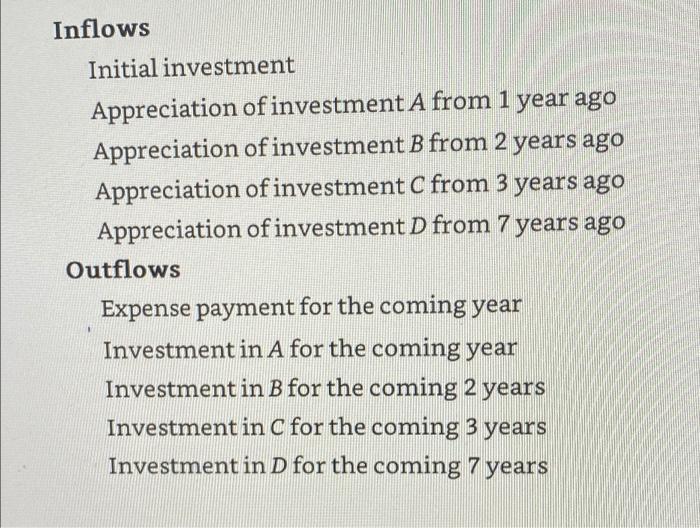
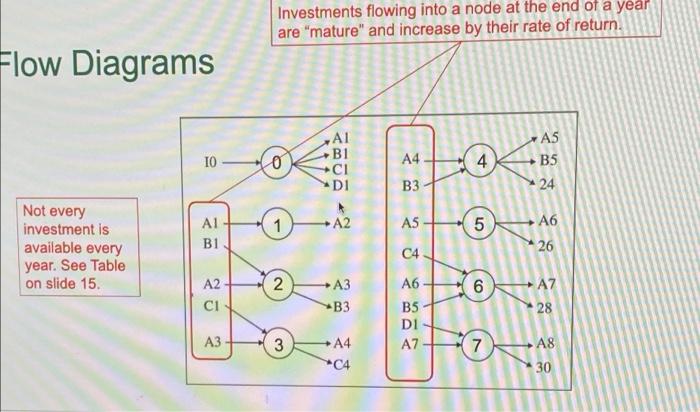
3. Refueling Airplanes Alpha Airlines wants to optimize its purchase of jet fuel in the cities it serves. The airline has a choice concerning how much fuel to place on board an aircraft for any flight segment, as long as minimum and maximum limits are met. The minimum and maximum limits of fuel that must be on an airplane at liftoff are shown in the table below. The fuel efficiency of an airplane is related to its weight, so an airplane carrying more fuel than needed to reach its destination wastes fuel. This fact suggests that a plane should take off with just enough fuel to reach its next destination. However, because fuel prices vary from city to city, a policy of minimal fuel purchase may be more costly than buying excess fuel at locations where fuel is inexpensive. If a plane has enough fuel left over from the previous flight to meet the minimum requirement, they may choose not to refuel at the city where they land before the next flight. Alpha Airlines has an airplane that flies a 5-city rotation based in Boston. Upon arriving in Boston, the airplane repeats the rotation the next day. The flight path is a continuous loop. For each flight segment, the table below displays the minimum and maximum fuel levels (in gallons) at takeoff, a formula for fuel consumption, and fuel prices at each departure location. From Boston Atlanta Atlanta Detroit Detroit Cincinnati Cincinnati Philadelphia Philadelphia Boston Min 2000 1200 400 800 600 Mox 2500 2500 2500 2500 2500 Consumption Price/gallon 1800+ 0.16 $6.20 1000+ 0.28G $6.60 300 +0.03G $6.25 600 +0.05G $6.50 500 +0.046 $6.05 The fuel consumption formula contains two terms: the first is the number of gallons consumed when the minimum amount of fuel is on board at takeoff; the second is the increment due to any additional gallons, G (beyond the minimum) on board at takeoff. To illustrate the formula, suppose that an airplane departs Philadelphia with 900 gallons of fuel. That means it is carrying 300 gallons above the minimum requirement. Then 0,04(300) = 12 additional galions will be consumed on the flight segment, for a total of 512 gallons by the time it lands. Questions a. Create a flow diagram for the problem with labeled ares to represent the potential in and out-flows for each city (see, for example, Lecture 5, slide 18). (8 pts) b. Determine an optimal daily fuel purchase plan for the 5-city rotation described above. How much fuel is purchased at each city? What is the total fuel cost for one rotation? (17 pts) 03 04 Two parents want to provide for their daughter's college education with some money they have recently inherited. They would like to set aside part of the inheritance in an account that would cover the needs of their daughter's college education, which begins 4 years from now. They estimate that first-year college expenses will come to $24,000 and increase $2,000 per year during each of the remaining 3 years of college. The table show the available investments Investment Available Matures (years) Return at Maturity (%) The parents would like to determine an investment plan Every year 1 that provides the necessary funds to cover college 8 1,3,5,7 2 expenses with the smallest initial investment 1,4 3 7 A 6 14 18 D 1 65 1 Inflows Initial investment Appreciation of investment A from 1 year ago Appreciation of investment B from 2 years ago Appreciation of investment C from 3 years ago Appreciation of investment D from 7 years ago Outflows Expense payment for the coming year Investment in A for the coming year Investment in B for the coming 2 years Investment in C for the coming 3 years Investment in D for the coming 7 years Investments flowing into a node at the end of a year are "mature" and increase by their rate of return. Flow Diagrams A5 IO o B1 CI D1 A4 4 4 B5 B3 24 1 A2 AS 5 A6 Not every investment is available every year. See Table on slide 15. A1 B1 C4 26 2 A3 A2 ci 16 CO A6 B5 DI A7 A7 28 B3 A3 3 7 A4 *C4 A8 30 3. Refueling Airplanes Alpha Airlines wants to optimize its purchase of jet fuel in the cities it serves. The airline has a choice concerning how much fuel to place on board an aircraft for any flight segment, as long as minimum and maximum limits are met. The minimum and maximum limits of fuel that must be on an airplane at liftoff are shown in the table below. The fuel efficiency of an airplane is related to its weight, so an airplane carrying more fuel than needed to reach its destination wastes fuel. This fact suggests that a plane should take off with just enough fuel to reach its next destination. However, because fuel prices vary from city to city, a policy of minimal fuel purchase may be more costly than buying excess fuel at locations where fuel is inexpensive. If a plane has enough fuel left over from the previous flight to meet the minimum requirement, they may choose not to refuel at the city where they land before the next flight. Alpha Airlines has an airplane that flies a 5-city rotation based in Boston. Upon arriving in Boston, the airplane repeats the rotation the next day. The flight path is a continuous loop. For each flight segment, the table below displays the minimum and maximum fuel levels (in gallons) at takeoff, a formula for fuel consumption, and fuel prices at each departure location. From Boston Atlanta Atlanta Detroit Detroit Cincinnati Cincinnati Philadelphia Philadelphia Boston Min 2000 1200 400 800 600 Mox 2500 2500 2500 2500 2500 Consumption Price/gallon 1800+ 0.16 $6.20 1000+ 0.28G $6.60 300 +0.03G $6.25 600 +0.05G $6.50 500 +0.046 $6.05 The fuel consumption formula contains two terms: the first is the number of gallons consumed when the minimum amount of fuel is on board at takeoff; the second is the increment due to any additional gallons, G (beyond the minimum) on board at takeoff. To illustrate the formula, suppose that an airplane departs Philadelphia with 900 gallons of fuel. That means it is carrying 300 gallons above the minimum requirement. Then 0,04(300) = 12 additional galions will be consumed on the flight segment, for a total of 512 gallons by the time it lands. Questions a. Create a flow diagram for the problem with labeled ares to represent the potential in and out-flows for each city (see, for example, Lecture 5, slide 18). (8 pts) b. Determine an optimal daily fuel purchase plan for the 5-city rotation described above. How much fuel is purchased at each city? What is the total fuel cost for one rotation? (17 pts) 03 04 Two parents want to provide for their daughter's college education with some money they have recently inherited. They would like to set aside part of the inheritance in an account that would cover the needs of their daughter's college education, which begins 4 years from now. They estimate that first-year college expenses will come to $24,000 and increase $2,000 per year during each of the remaining 3 years of college. The table show the available investments Investment Available Matures (years) Return at Maturity (%) The parents would like to determine an investment plan Every year 1 that provides the necessary funds to cover college 8 1,3,5,7 2 expenses with the smallest initial investment 1,4 3 7 A 6 14 18 D 1 65 1 Inflows Initial investment Appreciation of investment A from 1 year ago Appreciation of investment B from 2 years ago Appreciation of investment C from 3 years ago Appreciation of investment D from 7 years ago Outflows Expense payment for the coming year Investment in A for the coming year Investment in B for the coming 2 years Investment in C for the coming 3 years Investment in D for the coming 7 years Investments flowing into a node at the end of a year are "mature" and increase by their rate of return. Flow Diagrams A5 IO o B1 CI D1 A4 4 4 B5 B3 24 1 A2 AS 5 A6 Not every investment is available every year. See Table on slide 15. A1 B1 C4 26 2 A3 A2 ci 16 CO A6 B5 DI A7 A7 28 B3 A3 3 7 A4 *C4 A8 30
Step by Step Solution
There are 3 Steps involved in it

Get step-by-step solutions from verified subject matter experts