

Question: Please use FORMULATEXT function to show what you did. thanks! Download daily stock prices for the Vanguard Total Bond Market ETF (Ticker:BND) and the Vanguard
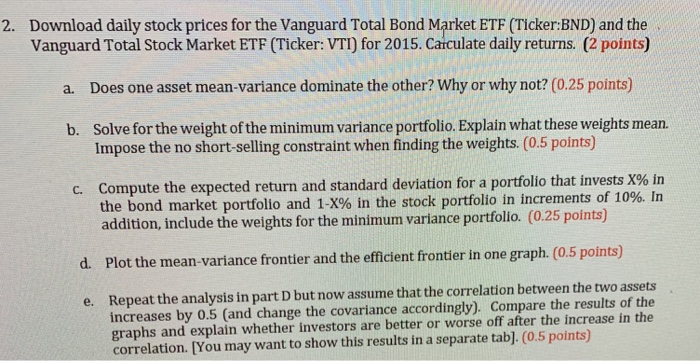
Download daily stock prices for the Vanguard Total Bond Market ETF (Ticker:BND) and the Vanguard Total Stock Market ETF (Ticker: VTI) for 2015. Carculate daily returns. (2 points) 2. Does one asset mean-variance dominate the other? Why or why not? (0.25 points) a. Solve for the weight of the minimum variance portfolio. Explain what these weights mean. Impose the no short-selling constraint when finding the weights. (0.5 points) b. Compute the expected return and standard deviation for a portfolio that invests X% in the bond market portfolio and 1-X% in the stock portfolio in increments of 10%. In addition, include the weights for the minimum variance portfolio. (0.25 points) c. d. Plot the mean-variance frontier and the efficient frontier in one graph. (0.5 points) e. Repeat the analysis in part D but now assume that the correlation between the two assets increases by 0.5 (and change the covariance accordingly). Compare the results of the graphs and explain whether investors are better or worse off after the increase in the correlation. [You may want to show this results in a separate tab]. (0.5 points) Download daily stock prices for the Vanguard Total Bond Market ETF (Ticker:BND) and the Vanguard Total Stock Market ETF (Ticker: VTI) for 2015. Carculate daily returns. (2 points) 2. Does one asset mean-variance dominate the other? Why or why not? (0.25 points) a. Solve for the weight of the minimum variance portfolio. Explain what these weights mean. Impose the no short-selling constraint when finding the weights. (0.5 points) b. Compute the expected return and standard deviation for a portfolio that invests X% in the bond market portfolio and 1-X% in the stock portfolio in increments of 10%. In addition, include the weights for the minimum variance portfolio. (0.25 points) c. d. Plot the mean-variance frontier and the efficient frontier in one graph. (0.5 points) e. Repeat the analysis in part D but now assume that the correlation between the two assets increases by 0.5 (and change the covariance accordingly). Compare the results of the graphs and explain whether investors are better or worse off after the increase in the correlation. [You may want to show this results in a separate tab]. (0.5 points)
Step by Step Solution
There are 3 Steps involved in it

Get step-by-step solutions from verified subject matter experts