

Question: please use MatLab. 2. Answer the following problems by developing a numeric integrator. (a) Consider q = 1.0 x 10C and m = 1 x
please use MatLab.
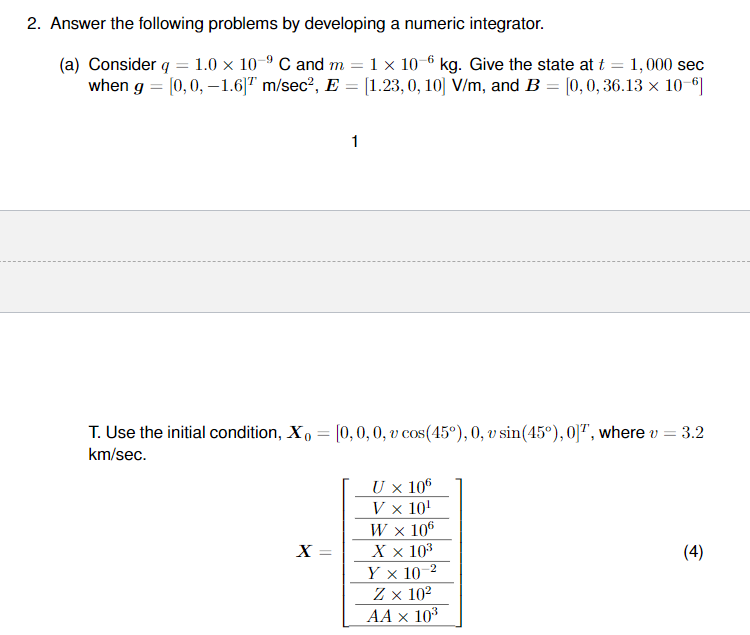
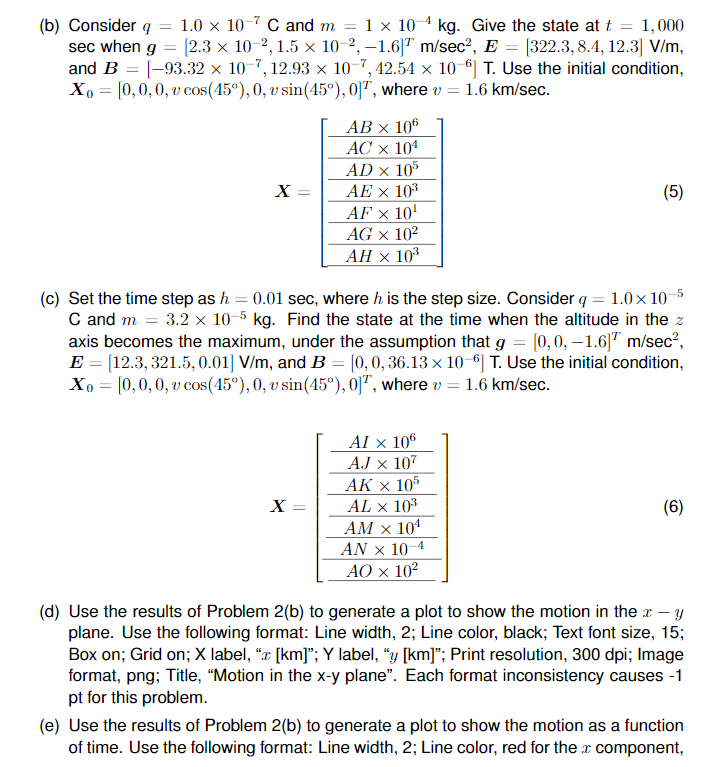
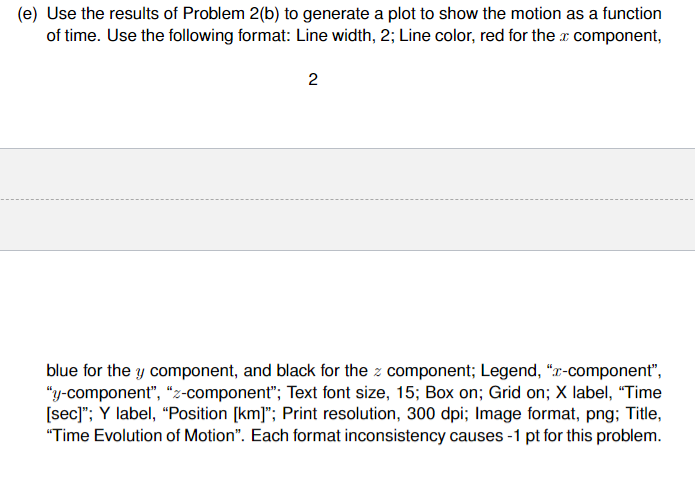
2. Answer the following problems by developing a numeric integrator. (a) Consider q = 1.0 x 10C and m = 1 x 10⁻⁶ kg. Give the state att 1,000 sec when g = [0,0,1.6)" m/sec?, E = (1.23, 0, 10) V/m, and B = [0,0, 36.13 x 10-61 1 T. Use the initial condition, X0 = [0,0,0, v cos(45), 0, u sin(45), 0", where v = 3.2 km/sec. X= U X 106 V x 10 W x 106 X x 103 Y x 10 2 x 102 AA x 103 (4) 2 (b) Considera 1.0 x 10⁻⁷ C and m - 1 x 10⁻⁴ kg. Give the state att 1,000 sec when g (2.3 x 10⁻², 1.5 x 10⁻², -1.6]m/sec?, E = (322.3, 8.4, 12.3] V/m, and B = (-93.32 x 10⁻⁷, 12.93 x 10-7,42.54 x 10-6) T. Use the initial condition, X, = [0,0,0, v cos(45), 0, v sin(45), 0)", where v = 1.6 km/sec. X= AB X 106 AC x 104 AD X 105 AE x 10 AF x 10 AG x 102 AH X 103 (5) -5 (c) Set the time step as h=0.01 sec, where h is the step size. Consider q = 1.0x10 C and m = 3.2 x 10⁻⁵ kg. Find the state at the time when the altitude in the z axis becomes the maximum, under the assumption that g = [0,0, -1.6" m/seca, E = [12.3, 321.5,0.01) V/m, and B = [0,0,36.13 x 10-6 T. Use the initial condition, X, = [0,0,0, v cos(45), 0, v sin(45), 0)", where v = 1.6 km/sec. X AI X 106 AJ X 107 AK 105 AL X 103 AM X 104 AN X 10-1 AO x 102 (6) (d) Use the results of Problem 2(b) to generate a plot to show the motion in the r - y plane. Use the following format: Line width, 2; Line color, black; Text font size, 15; Box on; Grid on; X label, z [km]"; Y label, y [km); Print resolution, 300 dpi; Image format, png; Title, Motion in the x-y plane. Each format inconsistency causes - 1 pt for this problem. (e) Use the results of Problem 2(b) to generate a plot to show the motion as a function of time. Use the following format: Line width, 2; Line color, red for the r component, (e) Use the results of Problem 2(b) to generate a plot to show the motion as a function of time. Use the following format: Line width, 2; Line color, red for the x component, 2 blue for the y component, and black for the 2 component; Legend, -component", y-component, z-component; Text font size, 15; Box on; Grid on; X label, Time [sec)"; Y label, Position [km]; Print resolution, 300 dpi; Image format, png; Title, "Time Evolution of Motion. Each format inconsistency causes - 1 pt for this problem. 2. Answer the following problems by developing a numeric integrator. (a) Consider q = 1.0 x 10C and m = 1 x 10⁻⁶ kg. Give the state att 1,000 sec when g = [0,0,1.6)" m/sec?, E = (1.23, 0, 10) V/m, and B = [0,0, 36.13 x 10-61 1 T. Use the initial condition, X0 = [0,0,0, v cos(45), 0, u sin(45), 0", where v = 3.2 km/sec. X= U X 106 V x 10 W x 106 X x 103 Y x 10 2 x 102 AA x 103 (4) 2 (b) Considera 1.0 x 10⁻⁷ C and m - 1 x 10⁻⁴ kg. Give the state att 1,000 sec when g (2.3 x 10⁻², 1.5 x 10⁻², -1.6]m/sec?, E = (322.3, 8.4, 12.3] V/m, and B = (-93.32 x 10⁻⁷, 12.93 x 10-7,42.54 x 10-6) T. Use the initial condition, X, = [0,0,0, v cos(45), 0, v sin(45), 0)", where v = 1.6 km/sec. X= AB X 106 AC x 104 AD X 105 AE x 10 AF x 10 AG x 102 AH X 103 (5) -5 (c) Set the time step as h=0.01 sec, where h is the step size. Consider q = 1.0x10 C and m = 3.2 x 10⁻⁵ kg. Find the state at the time when the altitude in the z axis becomes the maximum, under the assumption that g = [0,0, -1.6" m/seca, E = [12.3, 321.5,0.01) V/m, and B = [0,0,36.13 x 10-6 T. Use the initial condition, X, = [0,0,0, v cos(45), 0, v sin(45), 0)", where v = 1.6 km/sec. X AI X 106 AJ X 107 AK 105 AL X 103 AM X 104 AN X 10-1 AO x 102 (6) (d) Use the results of Problem 2(b) to generate a plot to show the motion in the r - y plane. Use the following format: Line width, 2; Line color, black; Text font size, 15; Box on; Grid on; X label, z [km]"; Y label, y [km); Print resolution, 300 dpi; Image format, png; Title, Motion in the x-y plane. Each format inconsistency causes - 1 pt for this problem. (e) Use the results of Problem 2(b) to generate a plot to show the motion as a function of time. Use the following format: Line width, 2; Line color, red for the r component, (e) Use the results of Problem 2(b) to generate a plot to show the motion as a function of time. Use the following format: Line width, 2; Line color, red for the x component, 2 blue for the y component, and black for the 2 component; Legend, -component", y-component, z-component; Text font size, 15; Box on; Grid on; X label, Time [sec)"; Y label, Position [km]; Print resolution, 300 dpi; Image format, png; Title, "Time Evolution of Motion. Each format inconsistency causes - 1 pt for this
Step by Step Solution
There are 3 Steps involved in it

Get step-by-step solutions from verified subject matter experts